Hi all,
I was trying various interpolators to use applying a transformation I got from a simple euclid 2d registration. The image I’m applying it to is a CT image, and I’m using a 64bit float image type.
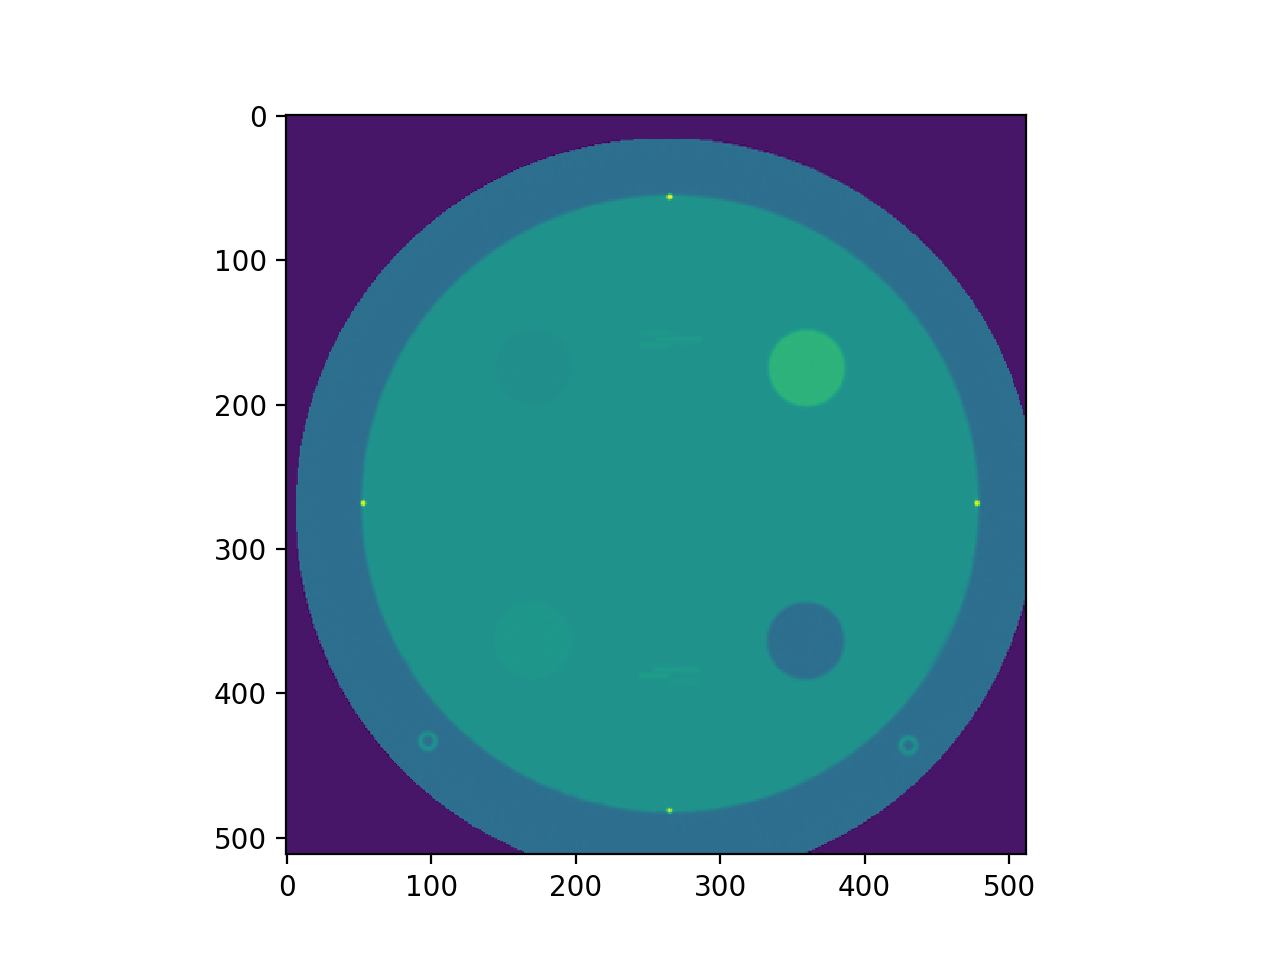
When I resample the image with my transformation, for at least a couple of the interpolators other than linear (Bspline and CoswindowSinc at least), the min and max of the pixel values after re-sampling is less than/greater than what it was prior to.
So the interpolation is resulting in pixel values outside the min/max bounds of the previous image pixels.
IMHO this seems like it shouldn’t be doing that - interpolating a new pixel value shouldn’t give you a value that below/above any of the neighbouring pixels regardless of which algorithm it’s using. …you’re meant to be interpolating between values right???
Is this the correct behavior???
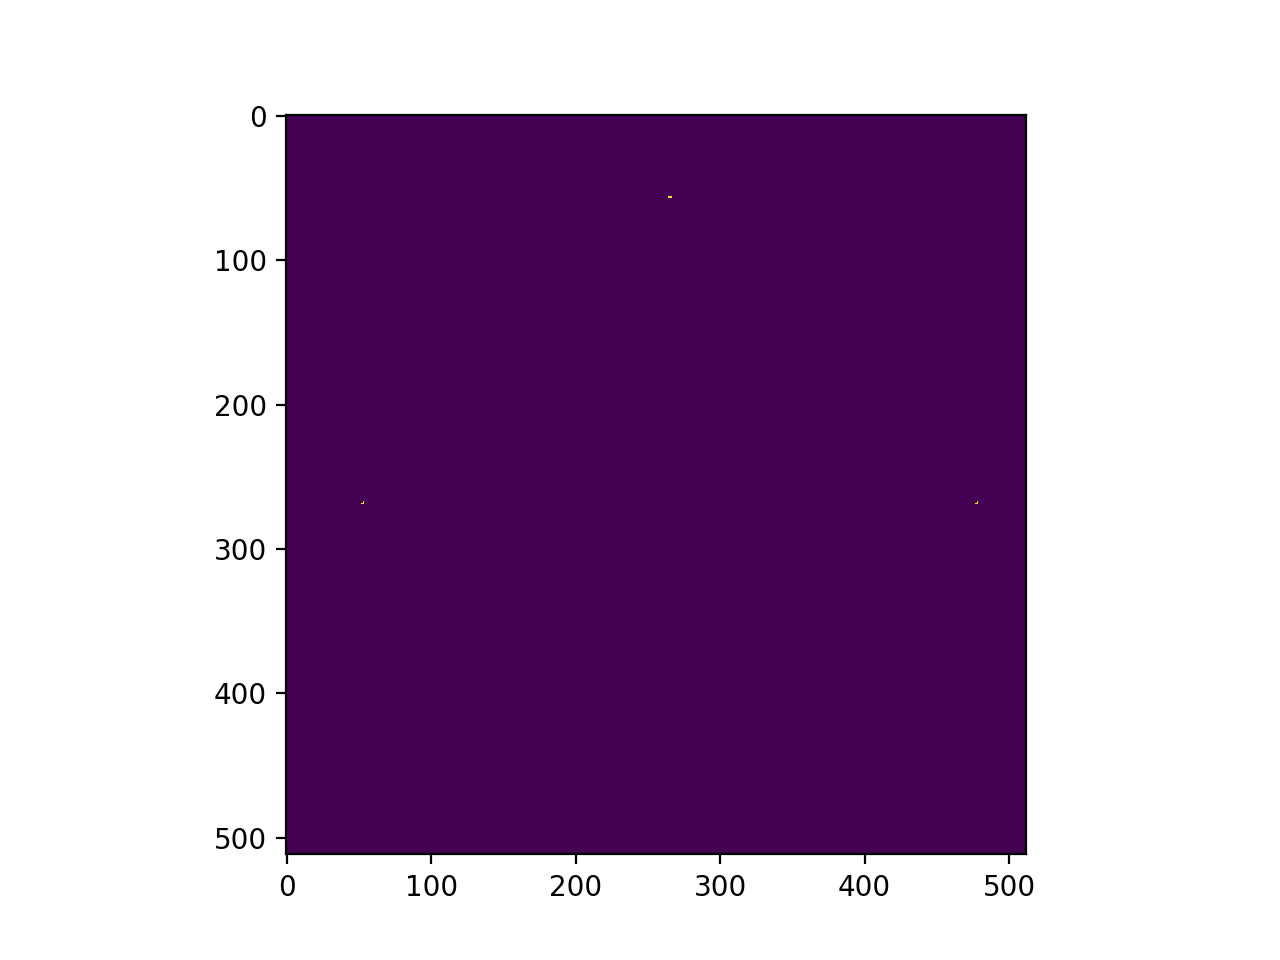
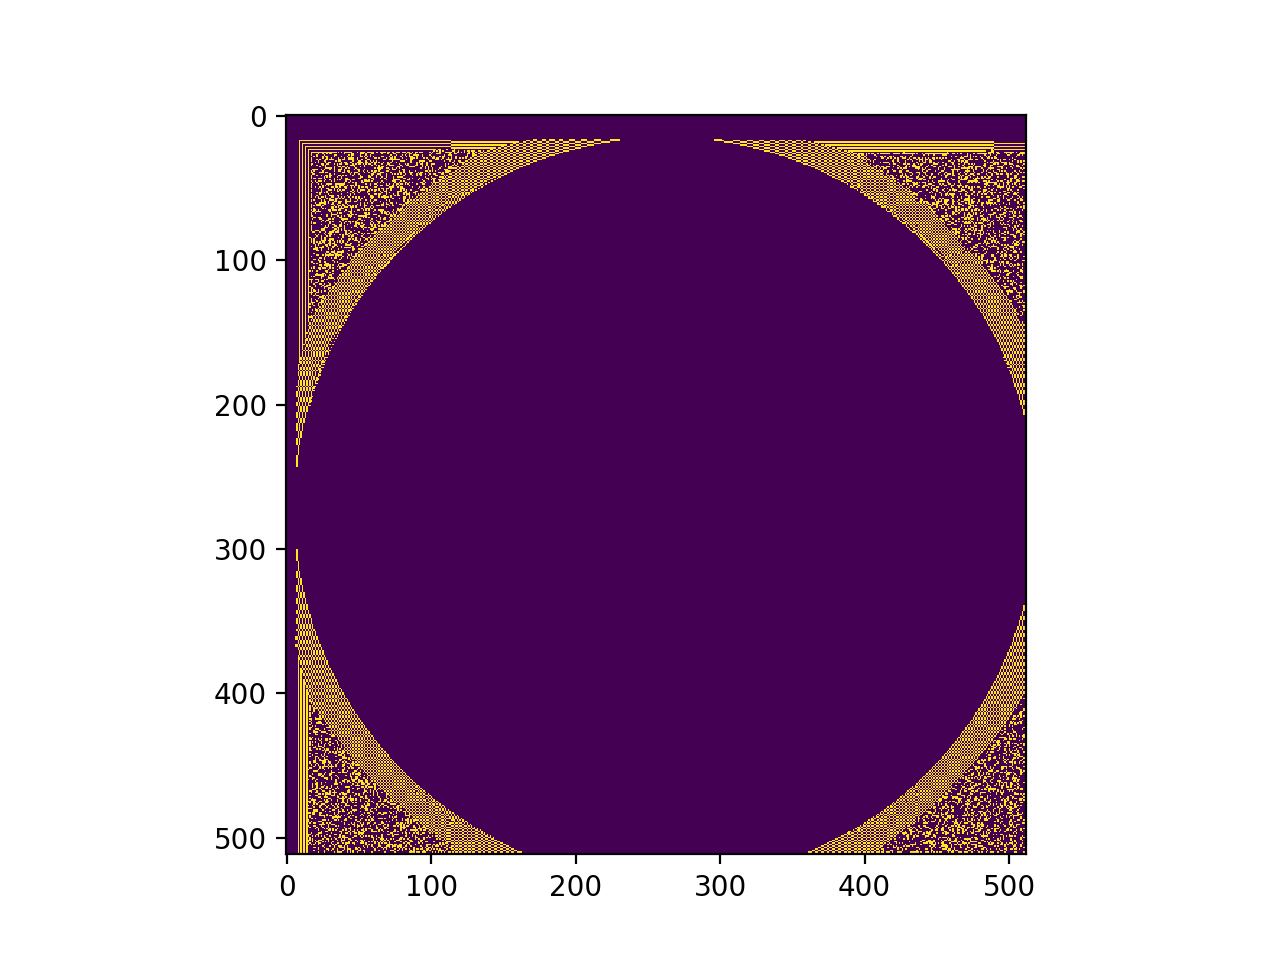
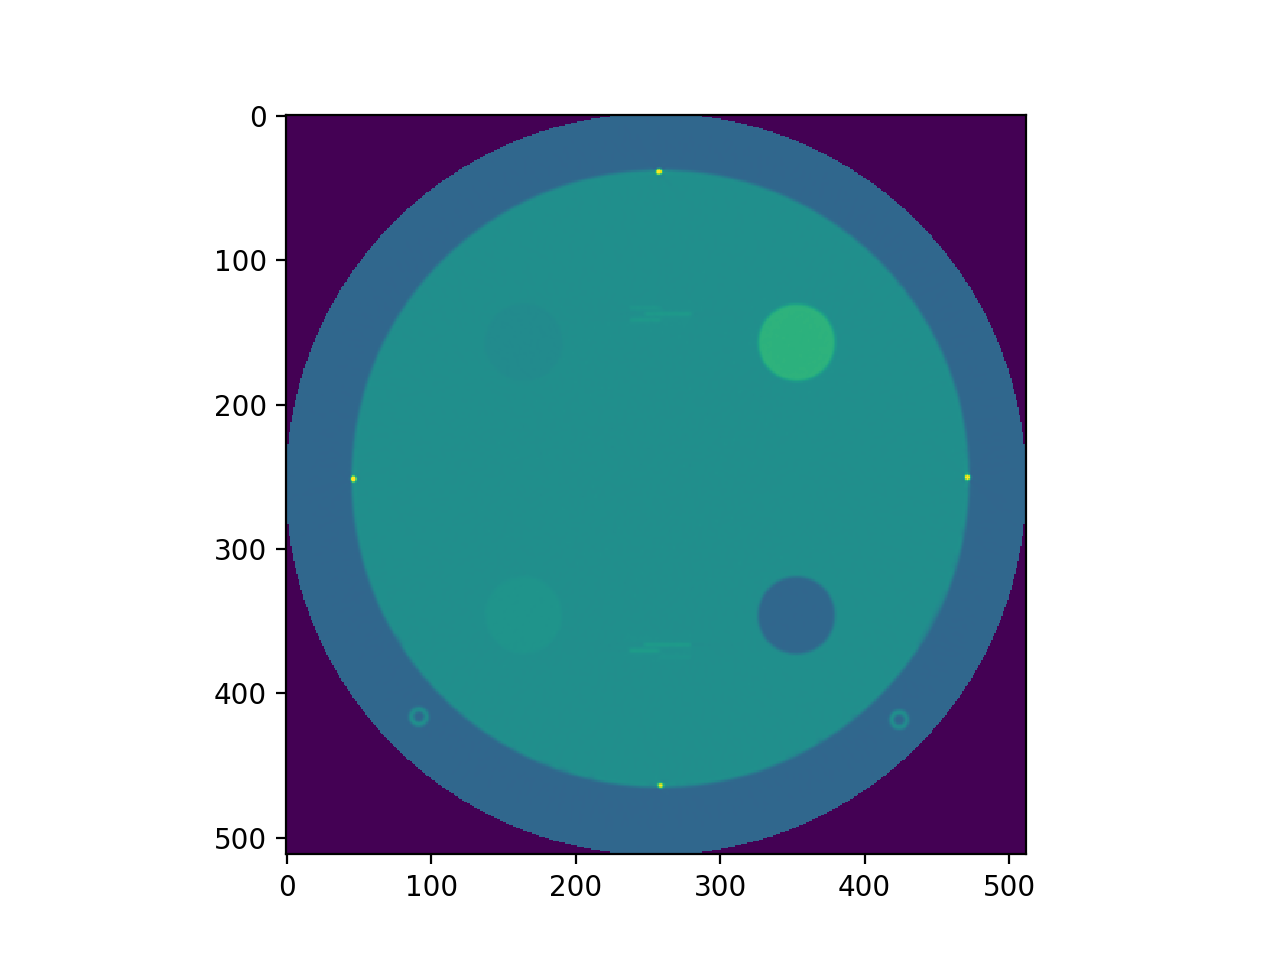
Here is a snippet of the code I’m using where it outputs this behavior, plus an output image from it where it clearly shows the min/max values of the resampled (translated) image have change a lot:
# want to translate the dicom scaled_pixel_array by the transform returned
# want the default pixel value to be take from the average in a corner of
# the array (to match the HU value of the background)

min_value = sitk.GetArrayViewFromImage(dcm_sitk).min()
max_value = sitk.GetArrayViewFromImage(dcm_sitk).max()
print('min/max pre transform', min_value, max_value)
plt.imshow(sitk.GetArrayViewFromImage(dcm_sitk))
plt.show()

# get background values from a corner average
background = np.average(sitk.GetArrayViewFromImage(dcm_sitk)[0:10,0:10])
print('background:', background)

dcm_sitk = sitk.Resample(dcm_sitk, dcm_sitk, transform,
        sitk.sitkBSpline, background)
        #sitk.sitkLinear, background)
        #sitk.sitkCosineWindowedSinc, background)

no_below = (sitk.GetArrayViewFromImage(dcm_sitk) < min_value).sum()
no_above = (sitk.GetArrayViewFromImage(dcm_sitk) > max_value).sum()

new_min_value = sitk.GetArrayViewFromImage(dcm_sitk).min()
new_max_value = sitk.GetArrayViewFromImage(dcm_sitk).max()

print('post transform', new_min_value, new_max_value)
print('number below min: ', no_below)
print('number above max: ', no_above)

plt.imshow(sitk.GetArrayViewFromImage(dcm_sitk))
plt.show()

below_img = (sitk.GetArrayViewFromImage(dcm_sitk) < min_value)
above_img = (sitk.GetArrayViewFromImage(dcm_sitk) > max_value)
plt.imshow(below_img)
plt.show()
plt.imshow(above_img)
plt.show()
Output:
min/max pre transform -3024.0 3071.0
background: -3024.0
post transform -3415.37375494161 3255.1812187911864
number below min:  18477
number above max:  9