Hi there,
I’m running into an issue when upsampling an image with SimpleITK. I’ve created a simple grid to test my upsampling code, and my SimpleITK implementation seems to introduce some shift. Any ideas what I’m doing wrong? I’ve attached a reference (scipy) implementation and my SimpleITK version below.
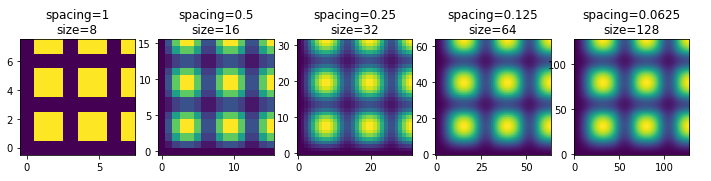
Scipy
import numpy as np
import scipy

# Create data.
spacing = 1
data = np.array([
    [0., 0., 0., 0., 0., 0., 0., 0.],
    [0., 1., 1., 0., 1., 1., 0., 1.],
    [0., 1., 1., 0., 1., 1., 0., 1.],
    [0., 0., 0., 0., 0., 0., 0., 0.],
    [0., 1., 1., 0., 1., 1., 0., 1.],
    [0., 1., 1., 0., 1., 1., 0., 1.],
    [0., 0., 0., 0., 0., 0., 0., 0.],
    [0., 1., 1., 0., 1., 1., 0., 1.]])

# Upsample.
def resample(data, spacing, output_spacing):
    scale = spacing / output_spacing
    resampled = scipy.ndimage.zoom(data, scale, order=1)
    return resampled

n_upsample = 5
_, axs = plt.subplots(1, n_upsample, figsize=(12, 6))
for ax in axs:
    ax.set_title(f"spacing={spacing}\nsize={data.shape[0]}")
    ax.imshow(np.transpose(data), origin='lower')
    output_spacing = spacing / 2
    data = resample(data, spacing, output_spacing)
    spacing = output_spacing
Output:
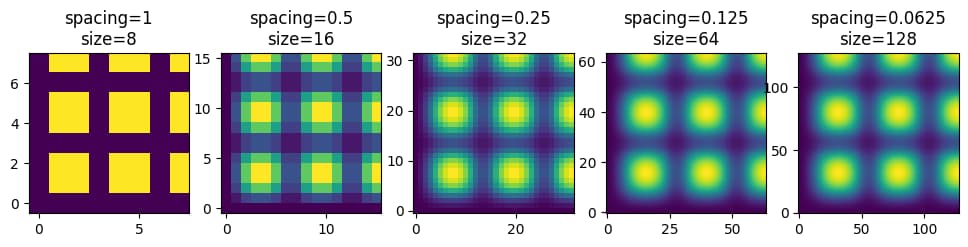
SimpleITK
import matplotlib.pyplot as plt
import numpy as np
import SimpleITK as sitk

# Create data.
spacing = (1, 1, 1)
data = np.array([
    [0., 0., 0., 0., 0., 0., 0., 0.],
    [0., 1., 1., 0., 1., 1., 0., 1.],
    [0., 1., 1., 0., 1., 1., 0., 1.],
    [0., 0., 0., 0., 0., 0., 0., 0.],
    [0., 1., 1., 0., 1., 1., 0., 1.],
    [0., 1., 1., 0., 1., 1., 0., 1.],
    [0., 0., 0., 0., 0., 0., 0., 0.],
    [0., 1., 1., 0., 1., 1., 0., 1.]])

# Upsample.
def resample(data, spacing, output_spacing):
    image = sitk.GetImageFromArray(data)
    image.SetSpacing(spacing)
    size = image.GetSize()

    size_scaling = np.array(spacing) / np.array(output_spacing)
    output_size = tuple(int(s * sc) for s, sc in zip(size, size_scaling))
    output_origin = image.GetOrigin()

    resampled = sitk.Resample(
        image,
        output_size,
        outputOrigin=output_origin,
        outputSpacing=output_spacing,
    )

    return sitk.GetArrayFromImage(resampled)

n_upsample = 5
_, axs = plt.subplots(1, n_upsample, figsize=(12, 6))
for ax in axs:
    ax.set_title(f"spacing={spacing[0]}\nsize={data.shape[0]}")
    ax.imshow(np.transpose(data), origin='lower')
    output_spacing = tuple(np.array(spacing) / 2)
    data = resample(data, spacing, output_spacing)
    spacing = output_spacing
Output:
Thanks,
Brett