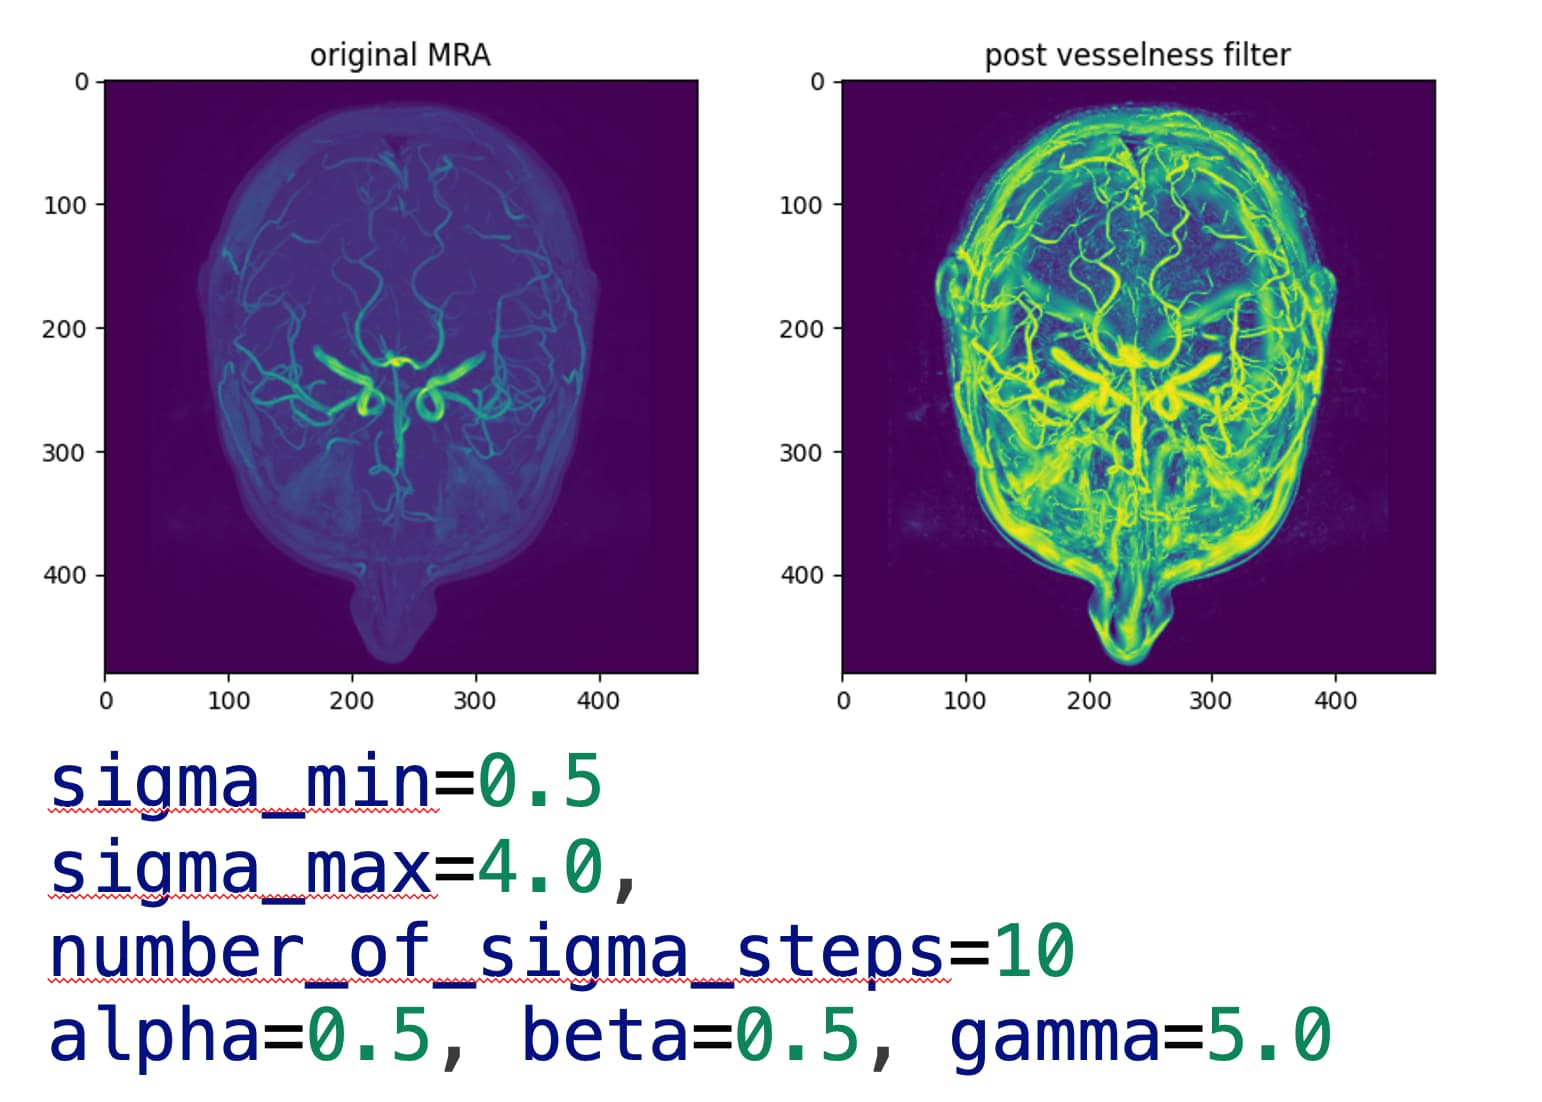
I am interested in applying a vesselness filter process to MRA images, referencing “Antiga, L. (2007). Generalizing vesselness with respect to dimensionality and shape. The Insight Journal.” I have written a script using Python 3.11.2.
After obtaining .GetScalesOutput() to check the scale values where pixels showed the best response, I attempted to convert it into a numpy array using itk.GetArrayFromImage. However, I encounter an error at the itk.GetArrayFromImage step. Is there any suggestion for improvement?
What does print(scales_image) shows? ScalesOutput should be a float image. Did you call multiScaleHessianFilter.GenerateScalesOutputOn() before multiScaleHessianFilter.Update()?
Thank you for the guidance. print(scales_image) shows itk.itkImagePython.itkImageF3. As you indicated, by inserting before .Update, I am now able to obtain the scale image.
Could you tell me more about how to adjust sigma_min and sigma_max based on the output from multiScaleHessianFilter.GetScalesOutput() ?
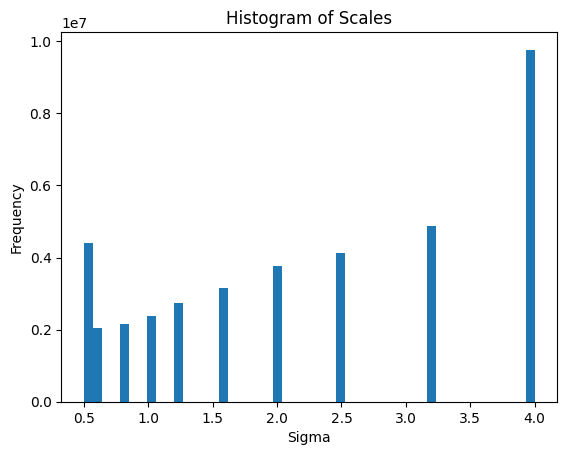
ChatGPT mentions, “It is possible to adjust sigma_min and sigma_max based on the information obtained from multiScaleHessianFilter.GetScalesOutput() . GetScalesOutput() provides the scale (sigma values) at which the filter showed the highest vesselness for each pixel. From this output, you can estimate the optimal range of scales for the vascular structures you wish to analyze. It was suggested to use the values at the smallest end of the scale distribution as a reference for adjusting sigma_min , and the values at the largest end of the scale distribution as a basis for adjusting sigma_max .”
However, when analyzing the histogram of the scale values provided by GetScalesOutput(), I end up with minimum and maximum scale values that match my initial settings.
I have read various literature but still haven’t found clear guidance on setting sigma_min and sigma_max optimally.
Your sigma_max seems too big. You could also share the scales image. You did not say what you are trying to accomplish, so providing advice is not easy.
Thank you for your response, and I apologize for the delay.
My MRA images have been resampled to an isotropic resolution of 0.5mm. In terms of the thickest vessels, such as the internal carotid artery, which is about 4mm (approximately 8 voxels), and the thinnest vessels found on the surface of the brain, which are about 1mm (2 voxels), I am trying to enhance these using a vesselness filter. However, I am struggling to determine the optimal settings for sigma_max and sigma_min for this purpose. Ultimately, I plan to use the vesselness filter image as a feature image for level set segmentation.