By: Matt McCormick  , Mary Elise Dedicke , Jean-Christophe Fillion-Robin , Will Schroeder
Did you know that your web browser comes bundled with extremely powerful development tools?
Modern web browsers are the foundation of the The Web Platform, a full-featured computing environment. However, full-featured platforms are not useful in and of themselves. A large community of software developers is required to program the applications on a platform that people love. And, effective debugging results in effective programming.
In this tutorial, we will learn how to debug itk-wasm C++ data processing pipelines built to WebAssembly (wasm) with the full-featured graphical debugger built into Chromium-based browsers.
In the following sections, we will first explain how to obtain a useful JavaScript backtrace in Node.js, then debug C++ code built to WebAssembly in a Chromium-based web browser. Let’s get started! ![]()
0. Preliminaries
Before starting this tutorial, check out our WASI WebAssembly command line debugging tutorial.
As with the previous tutorial, we will be debugging the following C++ code:
#include <iostream>

int main() {
  std::cout << "Hello debugger world!" << std::endl;

  const char * wasmDetails = "are no longer hidden";

  const int a = 1;
  const int b = 2;
  const auto c = a + b;

  // Simulate a crash.
  abort();
  return 0;
}
The tutorial code provides npm scripts as a convenient way to execute debugging commands, which you may also invoke directly in a command line shell.
1. Node.js Backtrace
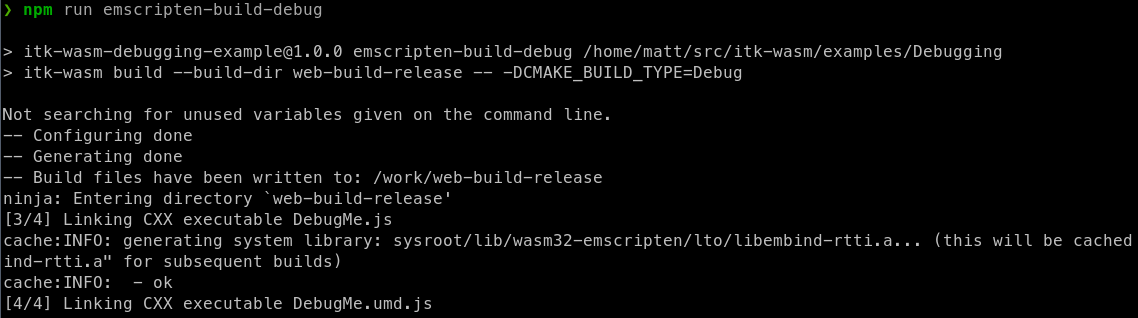
When debugging WebAssembly built with the itk-wasm Emscripten toolchain, set the CMAKE_BUILD_TYPE to Debug just like with native binary debug builds.
As with native builds, this build configuration adds debugging symbols, the human-readable names of functions, variables, etc., into the binary. This also adds support for C++ exceptions and retrieving the string name associated with exceptions. Without this itk-wasm instrumentation, a C++ exception will throw an error with an opaque integer value. And, Emscripten JavaScript WebAssembly bindings will not be minified, which facilitates debugging.
When built with the default Release build type:
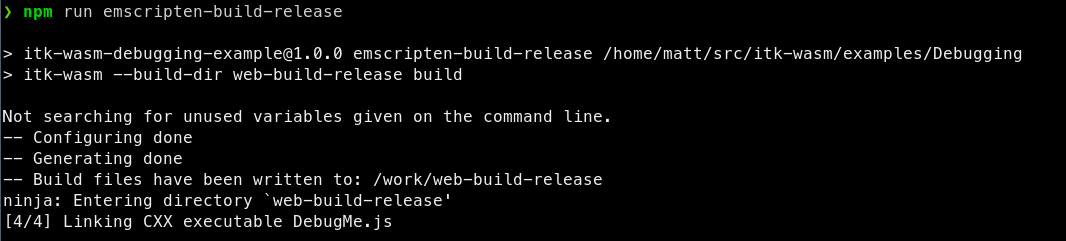
the JavaScript support code is minified, and difficult to debug:

However, when built with the Debug build type:
you can obtain a useful backtrace:
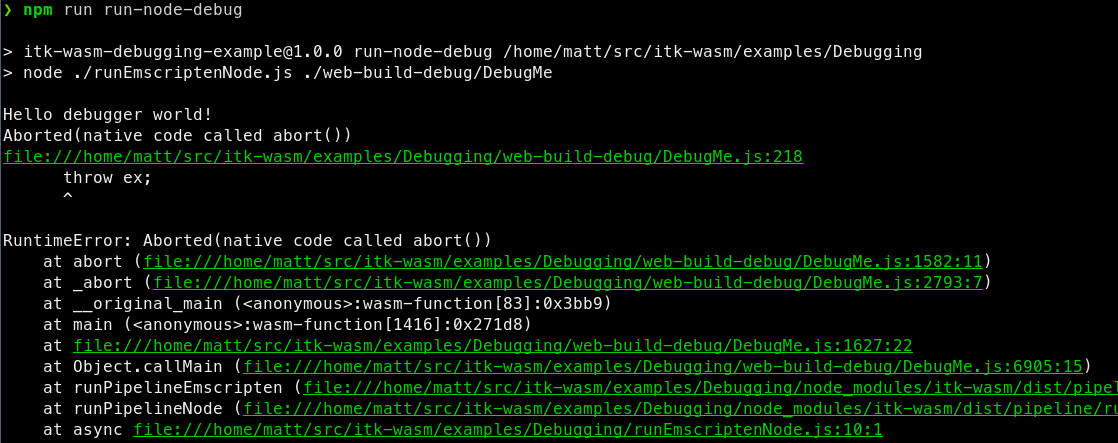
This is helpful for debugging issues that occur in the Emscripten JavaScript interface. The next section describes how to debug issues inside the Emscripten-generated WebAssembly.
2. Debugging in Chromium-based Browsers
Recent Chromium-based browsers have support for debugging C++ -based WebAssembly in the browser. With a few extra steps described in this section, it is possible to interactively step through and inspect WebAssembly that is compiled with C++ running in the browser.
WebAssembly debugging in DevTools requires a few extra setup steps compared to a default browser installation.
First, install the Chrome WebAssembly Debugging extension.
Next, enable it in DevTools:
- In DevTools, click the gear (
 ) icon in the top-right corner.
 - Go to the Experiments panel.
- Select WebAssembly Debugging: Enable DWARF support.
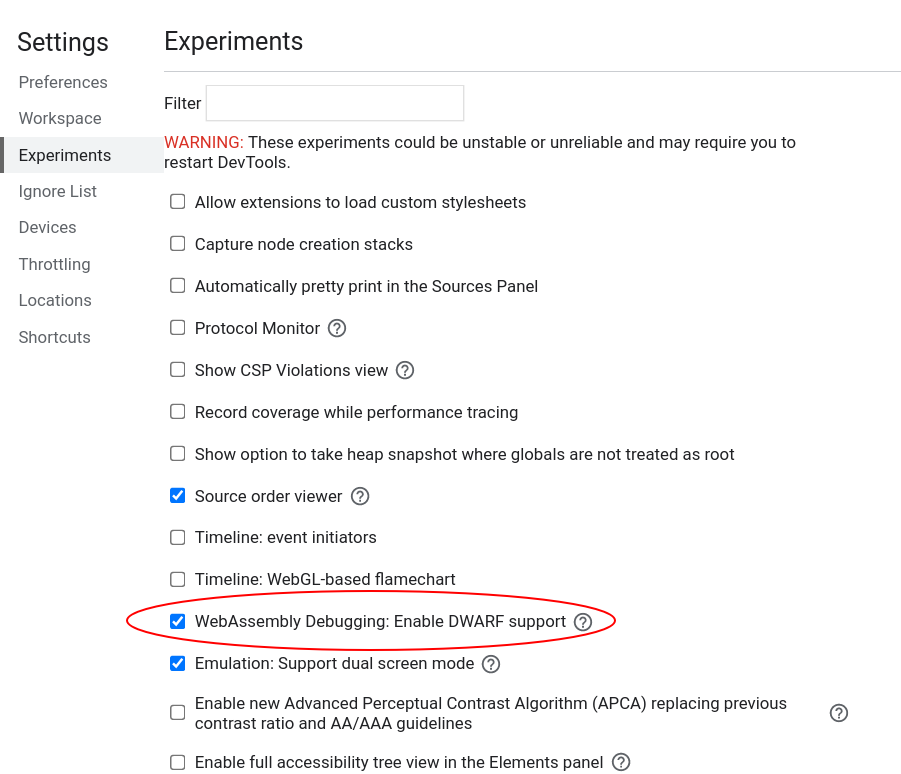
Exit Settings, then reload DevTools as prompted.
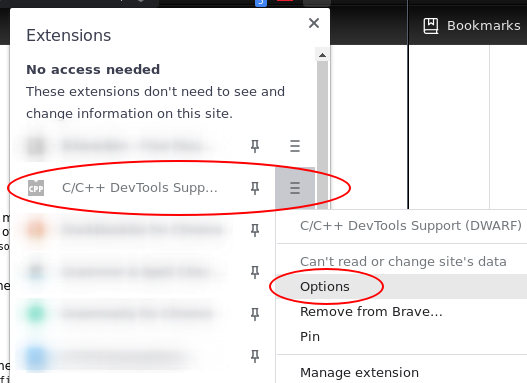
Next, open the options for the Chrome WebAssembly Debugging extension:
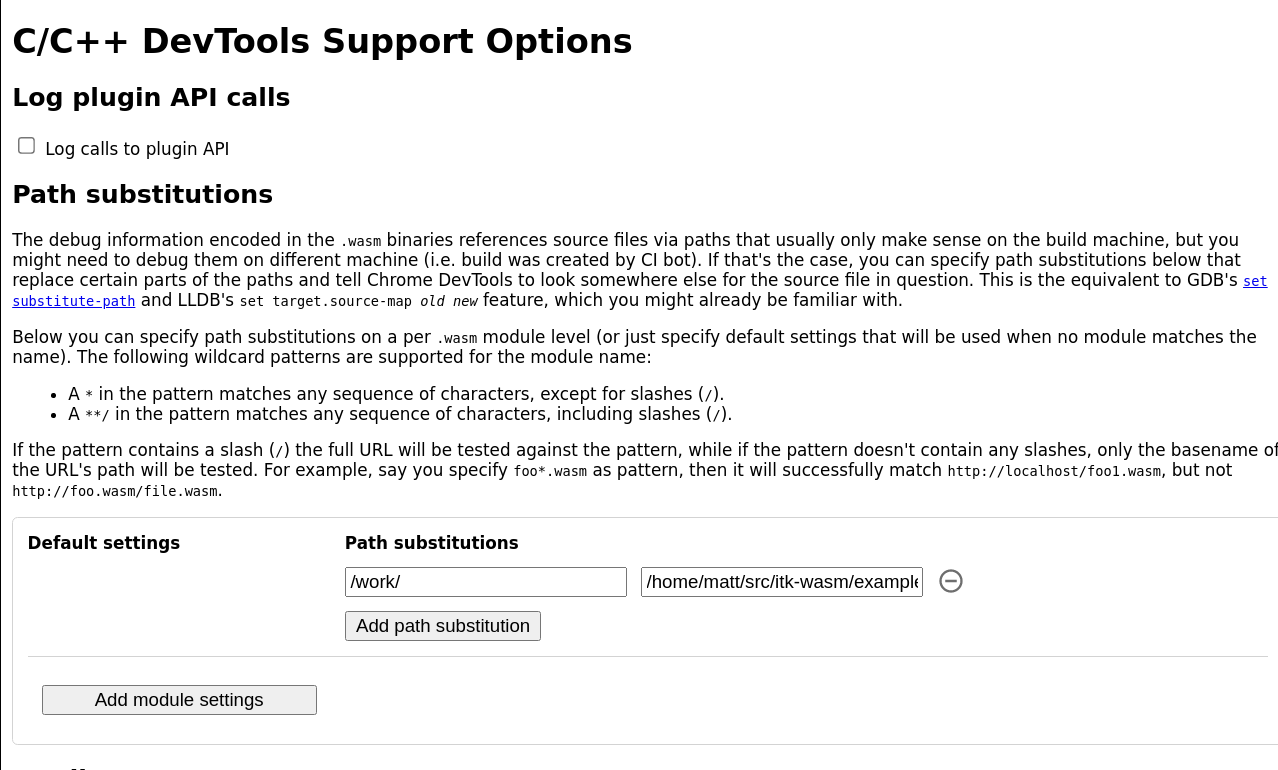
Since itk-wasm builds in a clean Docker environment, the debugging source paths in the Docker environment are different from the paths on the host system. The debugging extension has a path substitution system that can account for these differences. In the Docker image, the directory where itk-wasm is invoked is mounted as /work. Substitute /work with the directory where the itk-wasm CLI is invoked. For example, if itk-wasm was invoked at /home/matt/src/itk-wasm/examples/Debugging, then set the path substitution as shown below:
Build the project with itk-wasm and the Debug CMAKE_BUILD_TYPE to include DWARF debugging information:
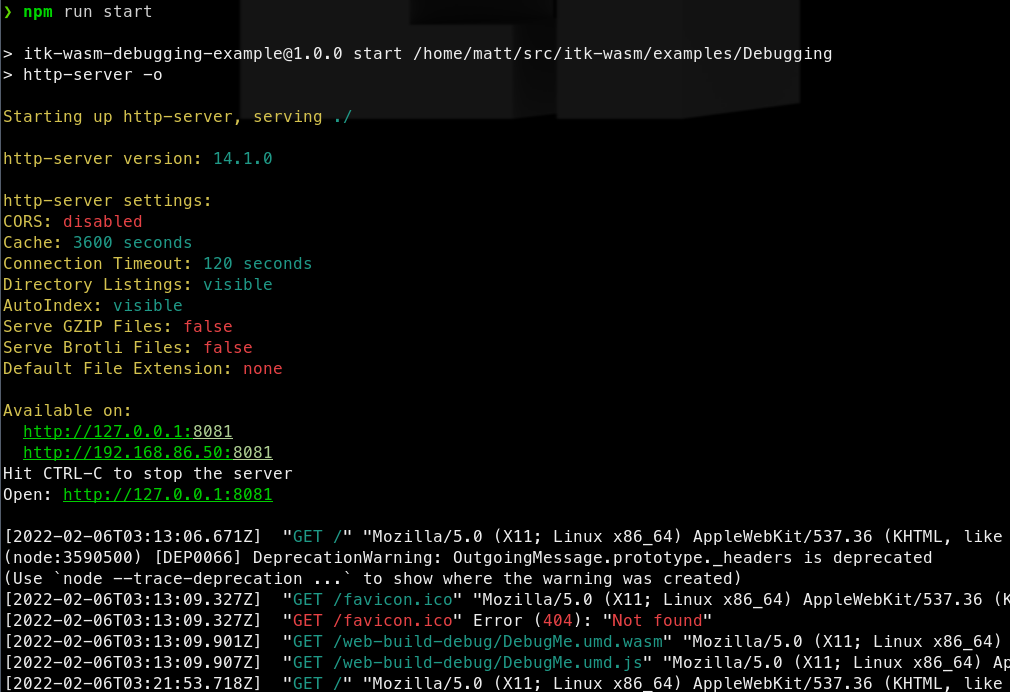
Here we load and run the WebAssembly with a simple HTML file and server:
<html>
  <head>
    <script src="https://cdn.jsdelivr.net/npm/itk-wasm@1.0.0-a.11/dist/umd/itk-wasm.js"></script>
  </head>
  <body>
    <p>This is an example to demonstrate browser-based debugging of
    C++-generated WebAssembly. For more information, please see the
    <a target="_blank" href="https://wasm.itk.org/examples/debugging.html">associated
      documentation</a>.</p>

    <script>
      window.addEventListener('load', (event) => {
        const pipeline = new URL('emscripten-build-debug/DebugMe', document.location)
        itk.runPipeline(null, pipeline)
      });
    </script>

  </body>
</html>
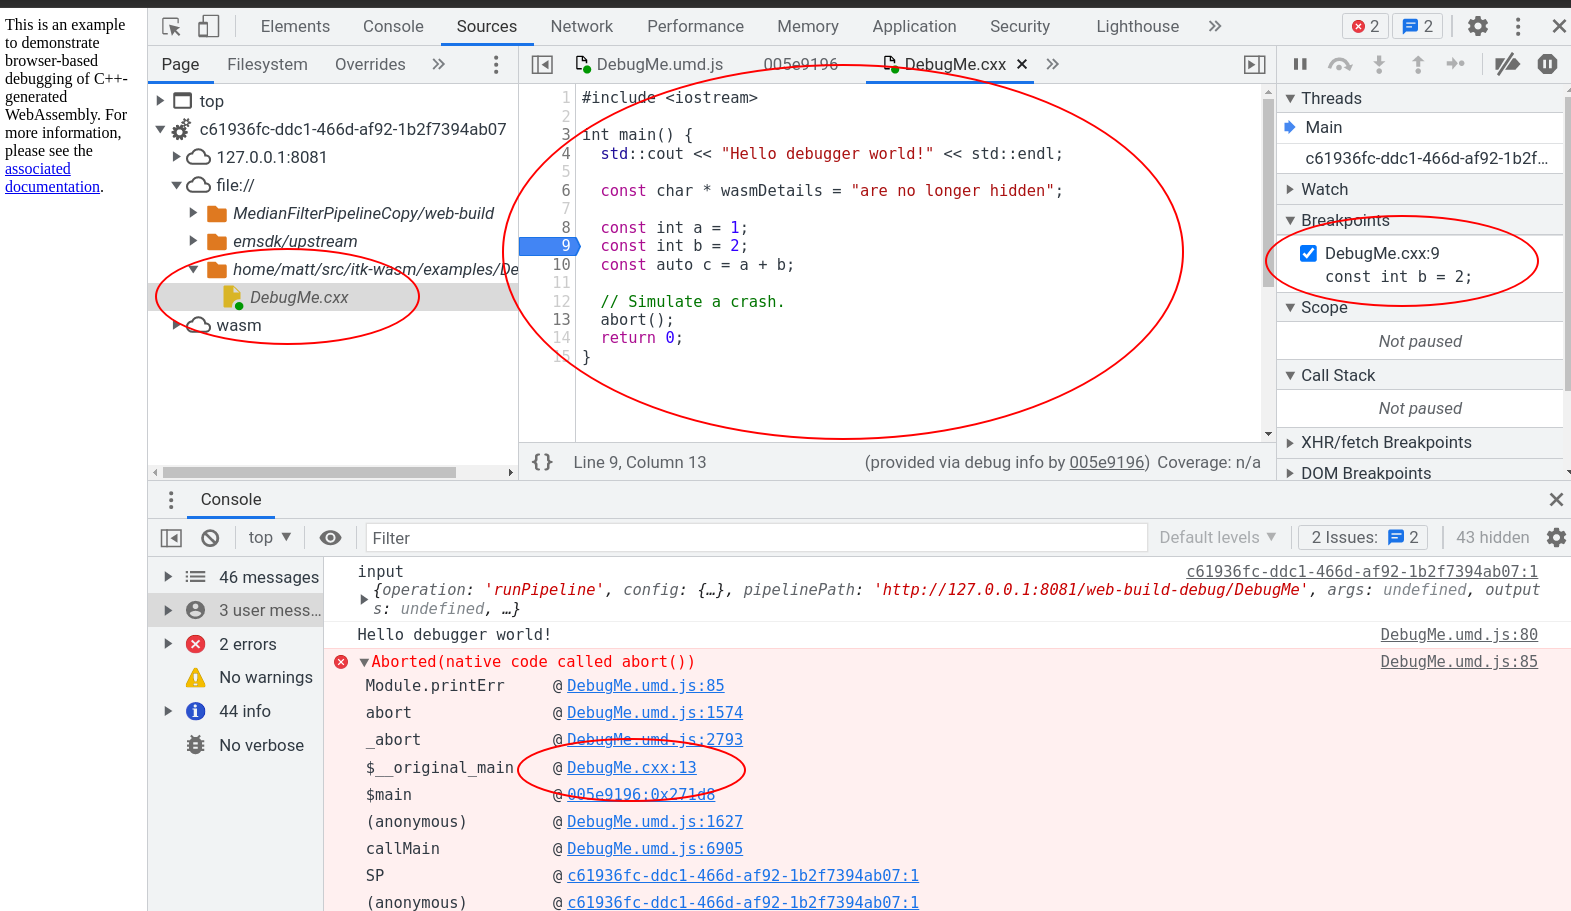
And we can debug the C++ code in Chrome’s DevTools debugger alongside the executing JavaScript!
What’s Next
In our next post, we will provide a tutorial on how to generate JavaScript and TypeScript bindings for Node.js and the browser.
Enjoy ITK!