I am trying to write a python code that extracts specific 2D slices from a 3D image and its segmentation then generates RGB image that shows both image and its segmentation in the extracted slice.
So far everything works but I am wondering if I can enhance the for loops part in the fusion section e.g. by numpy indexing or something similar.
import numpy as np, SimpleITK as sitk
fnmA = "img.png"
readerImg = sitk.ImageFileReader() ; readerImg.SetFileName(fnmA) ;
img =        readerImg.Execute();
a = sitk.GetArrayFromImage(img);

fnmB = "seg.png"
readerSeg = sitk.ImageFileReader() ; readerSeg.SetFileName(fnmB) ;
seg =  readerSeg.Execute();
b= sitk.GetArrayFromImage(seg);

maxJ=a.shape[0] ; print("max J: " +str(maxJ))
maxK=a.shape[0] ; print("max K: " +str(maxK))
img2d = sitk.Image([c.shape[1],c.shape[0]], sitk.sitkVectorUInt8, 3)
for j in range(0,maxJ):
     for k in range (0,maxK):
          v= [int(a[j][k]),int(a[j][k]),int(a[j][k])]
          vc=[150,80,100]
          img2d.SetPixel(k,j,v)
          if b[j][k]== 0:
             img2d.SetPixel(k,j,vc)
          #endif
      #endfor k
 #endfor j
 writerImg = sitk.ImageFileWriter()
 fnm ="rgb.png"
 writerImg.SetFileName(fnm)
 writerImg.Execute(img2d)
This is not the way to go. There are a variety of filters in SimpleITK that will allow you to combine an image and segmentation for visualization purposes, the most straightforward is LabelOverlayImageFilter. Please take a look at this Jupyter notebook which illustrates various filters and approaches for visualizing results from segmentation and registration using SimpleITK.
Hopefully one of these is what you are looking for. If not, let us know what is missing.
Another related question. How can we use the same concepts for two different images? e.g. fusion of the fixed and registered images to evaluate the registration visually.
Please take a look at the Jupyter notebook I pointed to in the previous response. It includes a variety of techniques for visualizing results including combining two scalar images which is what you are asking for (includes alpha blending, checkerboard, combining channels to create color image).
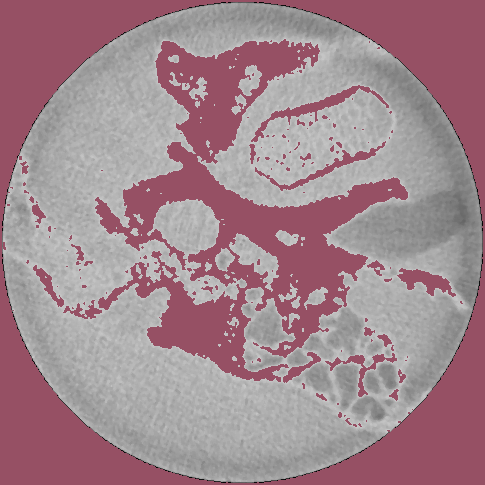
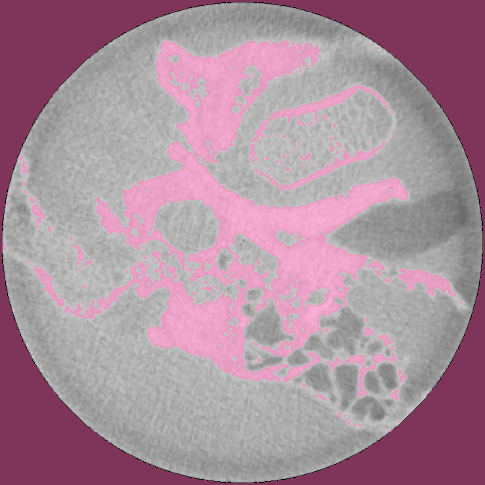
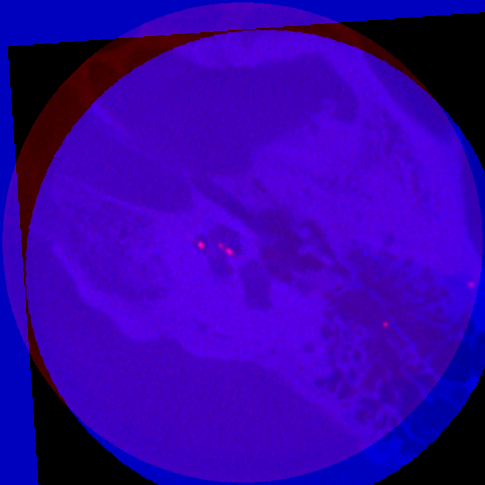
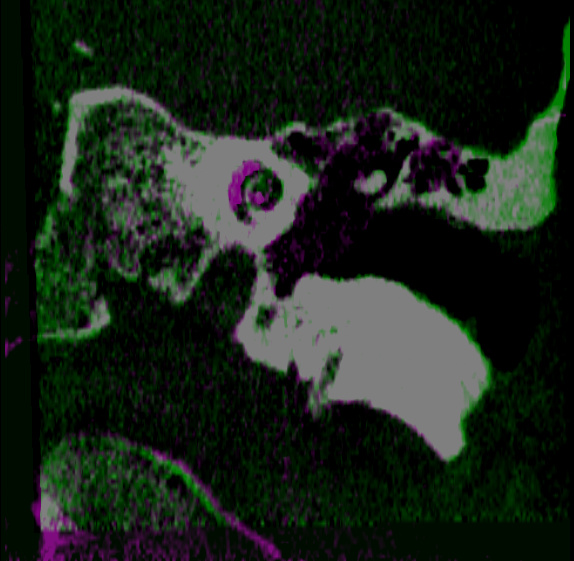
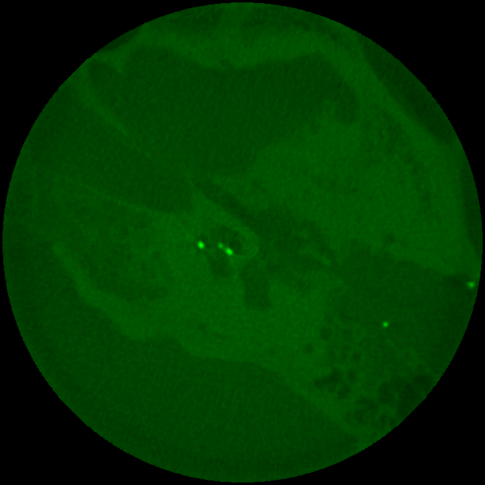
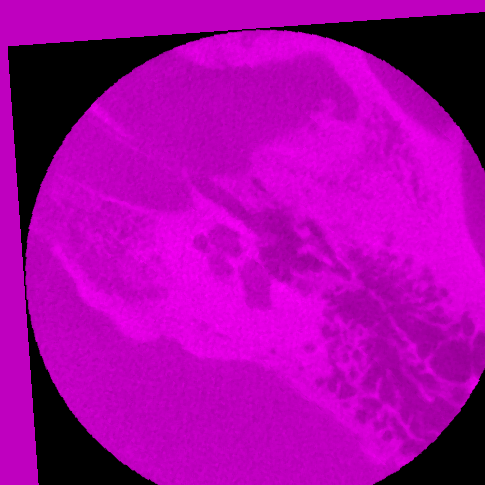
I just checked.What I want is to make the first image has a specific color e.g. Magenta and the second image has a different color e.g. green. The composed image should show the registration error (it will appear as magenta or green in our example). Assuming the two images bellow:
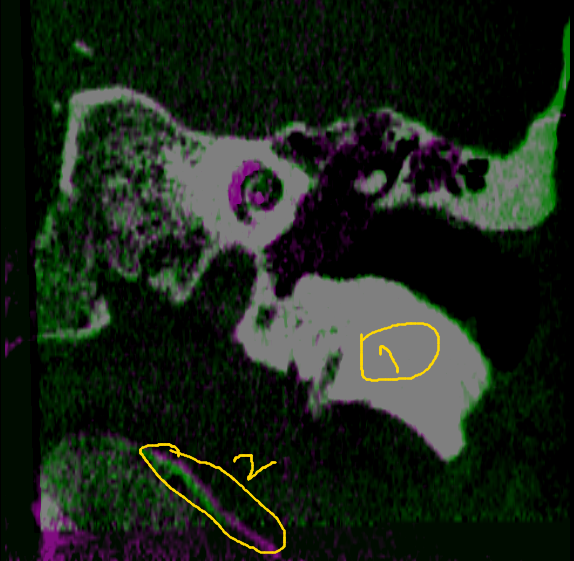
What I want, is something similar to these results (images are generated by 3D Slicer). Note the part 1 in yellow where both images match and part 2 in yellow where there is a small registration error.
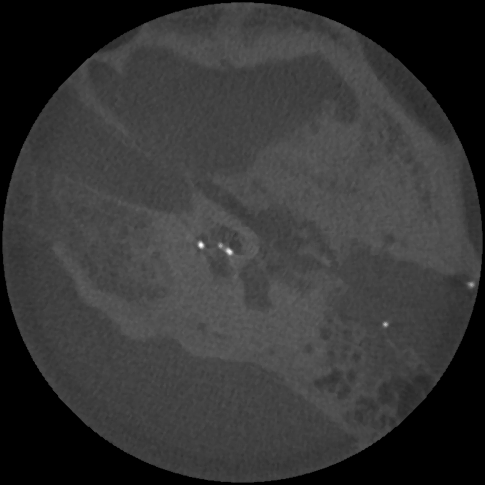
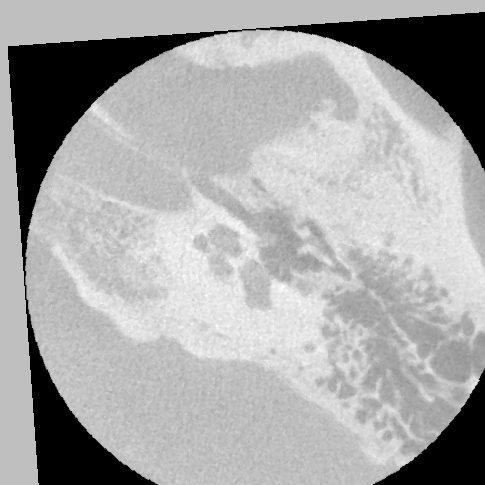
The issue with your example images is that the intensity levels of your two images are very different.
The first image has a few bright spots that are washing out the rest of the image. So the gray levels in the main structures of that image are in the 80-90 range.
If you look at your second image, the gray levels the 220-230 range. So if you put img2 in the red/blue channels and img1 in the green channel, the red/blue channels dominate. So it looks primarily magenta.
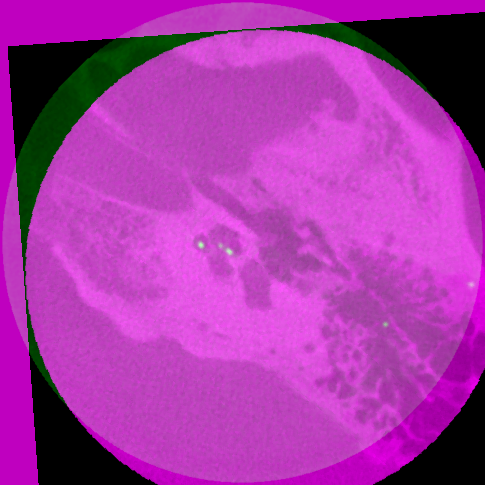
Here’s a little SimpleITK script I wrote to try and balance out the levels. Basically I scale the intensities of img2 by a factor of .4, to try and match the levels.
It sorts of works but could probably be better. I also tried using SimpleITK’s HistogramMatching filter, but that didn’t quite do what I wanted.
Basically you have to go back and get the same gray levels in the original image acquisition. Trying to match them afterwards doesn’t work that well. Fixing bad data as a post process is never as good as having good data from the start.