I am visualising multiple outputs in the same view depending on choices by the user (i.e. highlighting points on top of glyphs etc).
However, I am finding that as I add additional glyphs the colours of other sources change. This seems to only occur when you update the geometries of the view.
I have written a small example below.
Class to create the glyphs
Can either take in inputs as polydata, with the associated scalars, or as data points which are coloured manually
import vtk

class spherePipeline:
    def __init__(self):
        self.sphereSrc = vtk.vtkSphereSource()
        self.sphereSrc.SetRadius(0.5)

        self.glyphs = vtk.vtkGlyph3D()
        self.glyphs.ScalingOff()
        self.glyphs.SetColorModeToColorByScalar()
        self.glyphs.SetSourceConnection(self.sphereSrc.GetOutputPort())


    def setInput(self, data):
        self.glyphs.SetInputData(data)

    def setInputPoints(self, pts):

        # Set the data
        self.dataPoints = vtk.vtkPolyData()
        pd = vtk.vtkPoints()

        for pt in pts:
            pd.InsertNextPoint(pt[0], pt[1], pt[2])

        self.dataPoints.SetPoints(pd)

    def setPointColour(self, colorRGB):
        # Colour the data
        color = vtk.vtkUnsignedCharArray()
        color.SetName("colors")
        color.SetNumberOfComponents(3)
        for i in range(3):
            color.InsertTypedTuple(i, colorRGB)

        self.dataPoints.GetPointData().SetScalars(color)
        self.dataPoints.GetPointData().SetActiveScalars('colors')

        self.glyphs.SetInputData(self.dataPoints)

    def getGeometry(self):
        self.glyphs.Update()
        return self.glyphs.GetOutput()
Create instances of the class and pass in POINT data and colour the points
points1 = spherePipeline()
points2 = spherePipeline()
points3 = spherePipeline()

points1.setInputPoints(pts=[[0,0,0], [1,0,0], [2,0,0]])
points2.setInputPoints(pts=[[0,1,0], [1,1,0], [2,1,0]])
points3.setInputPoints(pts=[[0,2,0], [1,2,0], [2,2,0]])

points1.setPointColour(colorRGB=[255,0,0])
points2.setPointColour(colorRGB=[0,255,0])
points3.setPointColour(colorRGB=[0,0,255])
Show the geometries in the viewer
import itkwidgets
View = itkwidgets.view(geometries=None, background=[0.0, 0.0, 0.0])
View.geometries = [points1.getGeometry(), points2.getGeometry(), points3.getGeometry()]
View
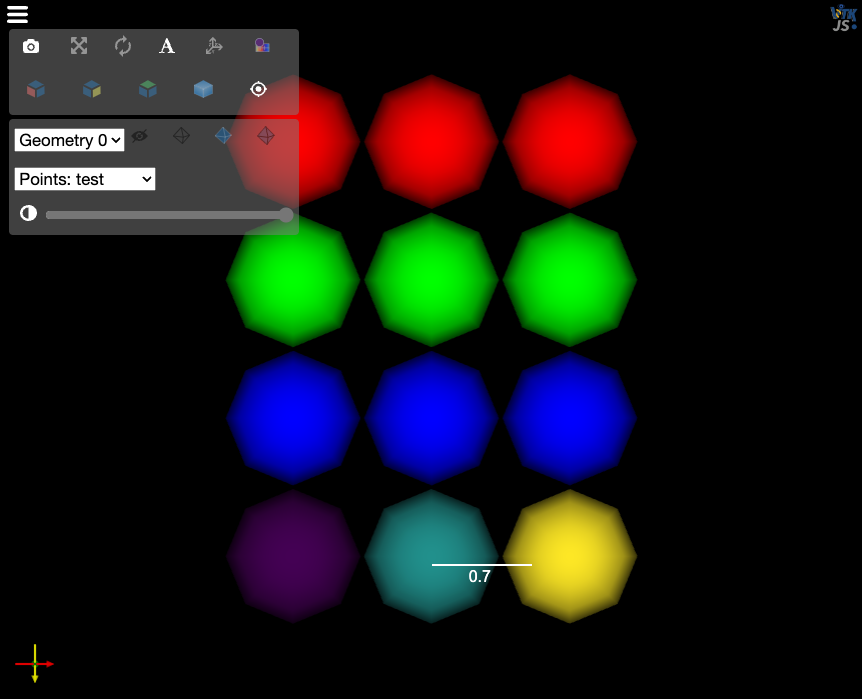
Viewer Output: As Expected
Create Polydata (data & scalar) to be passed as input to new glyph
data = np.array([[0,3,0], [1,3,0], [2,3,0]])
scalarName = 'test'
scalars = np.array(['1','2','3'])

def convertToPolydata(data, scalarName, scalars):

    pointData = vtk.vtkPoints()
    for ptId in range(data.shape[0]):
        dataPt = data[ptId]
        toPad = 3 - data.shape[1]
        if toPad > 0:
            embedPt = np.pad(dataPt, (0,toPad))

        pointData.InsertNextPoint(dataPt[0], dataPt[1], dataPt[2])
        polydata = vtk.vtkPolyData()
        polydata.SetPoints(pointData)

    scalarAr = vtk.vtkFloatArray()
    scalarAr.SetName(scalarName)
    scalarAr.SetNumberOfValues(len(scalars))
    ptId = 0

    if not isinstance(scalars[0], np.ndarray):
        newArray = np.unique(scalars, return_inverse=True)[1]
        for val in newArray:
            scalarAr.SetValue(ptId, float(val))
            ptId += 1

    else:
        for val in scalars:
            scalarAr.SetValue(ptId, float(val))
            ptId += 1

    polydata.GetPointData().AddArray(scalarAr)
    polydata.GetPointData().SetActiveScalars(scalarName)


    return polydata

polydata = convertToPolydata(data, scalarName, scalars)
Create instances of the class and pass in POLYDATA (points to be coloured by scalars)
data1 = spherePipeline()
data1.setInput(polydata)
Show the geometries in the viewer
View.geometries = [data1.getGeometry(), points1.getGeometry(), points2.getGeometry(), points3.getGeometry()]
View
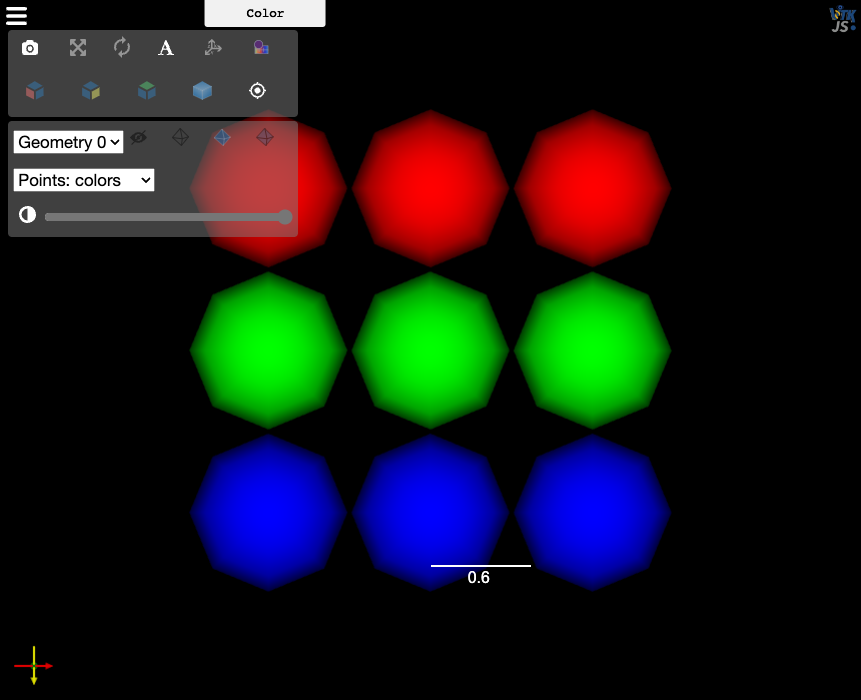
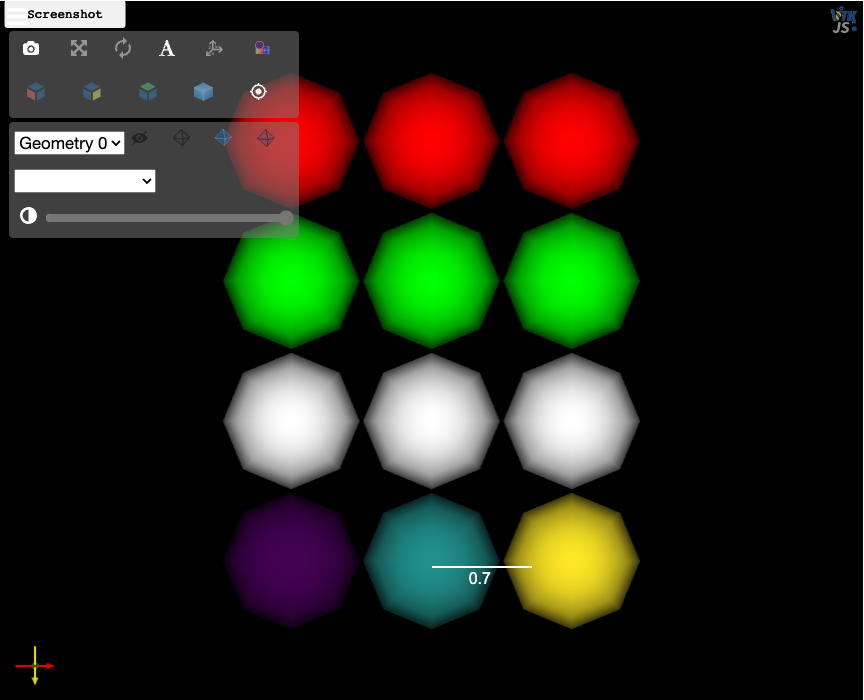
Viewer Output:
Note that the Blue glyphs have changed colour!
NOTE: If I create a new Viewer (i.e.
itkwidgets.view(geometries=[data1.getGeometry(), points1.getGeometry(), points2.getGeometry(), points3.getGeometry()], background=[0.0, 0.0, 0.0])
the colours are presented correctly.