# Brainstorming ideas: Better Overlay Experience in Jupyter Notebooks
**URL:** https://discourse.itk.org/t/brainstorming-ideas-better-overlay-experience-in-jupyter-notebooks/4514
**Category:** Community
**Tags:** python
**Created:** [October 20, 2021, 3:16pm UTC](https://discourse.itk.org/t/brainstorming-ideas-better-overlay-experience-in-jupyter-notebooks/4514 "2021-10-20T15:16:26Z")
**Posts on this page:** 2
**Page:** 1
### Author:  [@kolibril13](https://discourse.itk.org/u/kolibril13)
#### Post date: [October 20, 2021, 3:16pm UTC](https://discourse.itk.org/t/brainstorming-ideas-better-overlay-experience-in-jupyter-notebooks/4514/1 "2021-10-20T15:16:26Z")
While iterating on a segmentation workflow, it is good to have a previous/after view.
Currently, that can be done with an [overlay](https://itk.org/ITKExamples/src/Filtering/ImageFusion/OverlayLabelMapOnTopOfAnImage/Documentation.html) or displaying the pictures left and right.
I just want to propose some ideas that would make it more interactive to explore data.
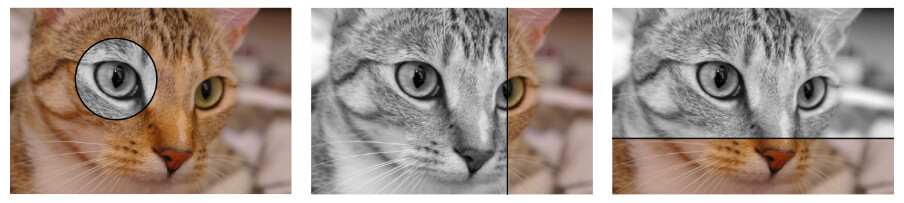
Here are some conceptual ideas:
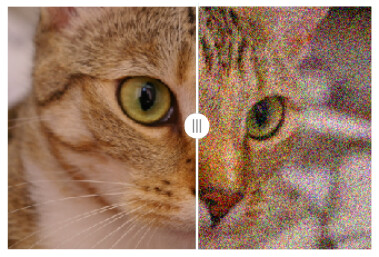
Left-Right-Slider:
Showing a round frame when hovering with the mouse:

Same, but, opacity of second layer reduces Gaussian-like) when hovering with the mouse:
Here is how the code could look like:
```auto
from skimage import data
from skimage.util import random_noise
import matplotlib.pyplot as plt
import numpy as np
img = data.chelsea()
noisy_img = random_noise(img, var=0.02)
fig1= plt.figure()
plt.imshow(img)
plt.axis('off')
fig2= plt.figure()
plt.imshow(noisy_img)
plt.axis('off')
#new part (does not exist yet):
from splitview import SplitMapControl
control = SplitMapControl(left_layer=fig1, right_layer=fig2)
m.add_control(control)
```
I don’t want to suggest that this should be a feature of itk, I just want to share this idea, that might be very useful in the Jupyter environment for image analysis.
Maybe this can become a Jupyter widget one day.
And this is the code to reproduce the two mouse-hover examples:
```auto
from skimage import data
import matplotlib.pyplot as plt
import numpy as np
import cv2
plt.rcParams['image.cmap']='gray'
def rgb2gray(rgb):
return np.dot(rgb[...,:3], [0.2989, 0.5870, 0.1140])
img = data.chelsea()
bw_img = rgb2gray(img)
rgba = cv2.cvtColor(img, cv2.COLOR_RGB2RGBA)
pixY,pixX , _ = img.shape
# disk
x, y = np.ogrid[0:pixY, 0:pixX]
x, y
mask = (x - pixY/2) **2 + (y - pixX/2)** 2 > 100 ** 2
rgba = cv2.cvtColor(img, cv2.COLOR_RGB2RGBA)
rgba[:,:,3]=255*(1-mask)
print((rgba.shape))
plt.axis('off')
plt.imshow(bw_img)
plt.imshow(rgba)
# gauss
x, y = np.meshgrid(np.linspace(-1,1,pixX), np.linspace(-1,1,pixY))
d = np.sqrt(x**2+(y*0.78)**2)
sigma, mu = 0.4, 0
g = 255*np.exp(-( (d-mu)**2 / ( 2.0 * sigma**2 ) ) )
rgba[:,:,3]=g
print((rgba[0,0]))
plt.figure()
plt.axis('off')
plt.imshow(bw_img)
plt.imshow(rgba)
```
---
### Author:  [@kolibril13](https://discourse.itk.org/u/kolibril13)
#### Post date: [July 29, 2022, 8:28pm UTC](https://discourse.itk.org/t/brainstorming-ideas-better-overlay-experience-in-jupyter-notebooks/4514/2 "2022-07-29T20:28:54Z")
With a friend, I’ve now written [GitHub - Octoframes/jupyter\_compare\_view: Blend Between Multiple Images in JupyterLab.](https://github.com/Octoframes/jupyter_compare_view)