# Adding additional geometries to Viewer changes colours of outputs
**URL:** https://discourse.itk.org/t/adding-additional-geometries-to-viewer-changes-colours-of-outputs/5449
**Category:** Beginner Questions
**Tags:** python
**Created:** [October 26, 2022, 12:02pm UTC](https://discourse.itk.org/t/adding-additional-geometries-to-viewer-changes-colours-of-outputs/5449 "2022-10-26T12:02:29Z")
**Posts on this page:** 4
**Page:** 1
### Author:  [@Kevin\_Sweeney](https://discourse.itk.org/u/Kevin_Sweeney)
#### Post date: [October 26, 2022, 12:02pm UTC](https://discourse.itk.org/t/adding-additional-geometries-to-viewer-changes-colours-of-outputs/5449/1 "2022-10-26T12:02:29Z")
I am visualising multiple outputs in the same view depending on choices by the user (i.e. highlighting points on top of glyphs etc).
However, I am finding that as I add additional glyphs the colours of other sources change. This seems to only occur when you update the geometries of the view.
I have written a small example below.
**Class to create the glyphs**
Can either take in inputs as `polydata`, with the associated scalars, or as data points which are coloured manually
```python
import vtk
class spherePipeline:
def __init__ (self):
self.sphereSrc = vtk.vtkSphereSource()
self.sphereSrc.SetRadius(0.5)
self.glyphs = vtk.vtkGlyph3D()
self.glyphs.ScalingOff()
self.glyphs.SetColorModeToColorByScalar()
self.glyphs.SetSourceConnection(self.sphereSrc.GetOutputPort())
def setInput(self, data):
self.glyphs.SetInputData(data)
def setInputPoints(self, pts):
# Set the data
self.dataPoints = vtk.vtkPolyData()
pd = vtk.vtkPoints()
for pt in pts:
pd.InsertNextPoint(pt[0], pt[1], pt[2])
self.dataPoints.SetPoints(pd)
def setPointColour(self, colorRGB):
# Colour the data
color = vtk.vtkUnsignedCharArray()
color.SetName("colors")
color.SetNumberOfComponents(3)
for i in range(3):
color.InsertTypedTuple(i, colorRGB)
self.dataPoints.GetPointData().SetScalars(color)
self.dataPoints.GetPointData().SetActiveScalars('colors')
self.glyphs.SetInputData(self.dataPoints)
def getGeometry(self):
self.glyphs.Update()
return self.glyphs.GetOutput()
```
**Create instances of the class and pass in POINT data and colour the points**
```python
points1 = spherePipeline()
points2 = spherePipeline()
points3 = spherePipeline()
points1.setInputPoints(pts=[[0,0,0], [1,0,0], [2,0,0]])
points2.setInputPoints(pts=[[0,1,0], [1,1,0], [2,1,0]])
points3.setInputPoints(pts=[[0,2,0], [1,2,0], [2,2,0]])
points1.setPointColour(colorRGB=[255,0,0])
points2.setPointColour(colorRGB=[0,255,0])
points3.setPointColour(colorRGB=[0,0,255])
```
**Show the geometries in the viewer**
```python
import itkwidgets
View = itkwidgets.view(geometries=None, background=[0.0, 0.0, 0.0])
View.geometries = [points1.getGeometry(), points2.getGeometry(), points3.getGeometry()]
View
```
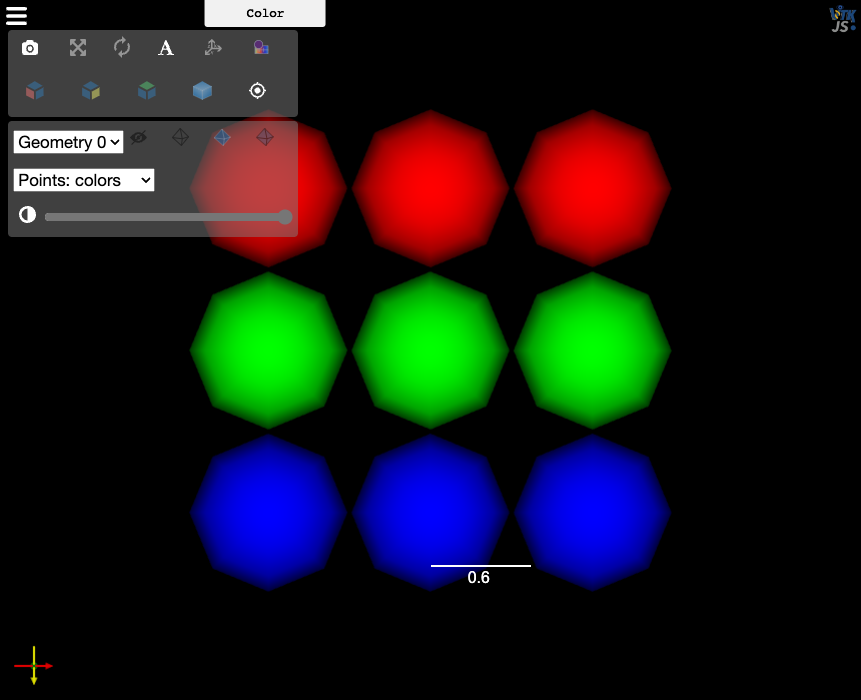
**Viewer Output: As Expected**
**Create Polydata (data & scalar) to be passed as input to new glyph**
```python
data = np.array([[0,3,0], [1,3,0], [2,3,0]])
scalarName = 'test'
scalars = np.array(['1','2','3'])
def convertToPolydata(data, scalarName, scalars):
pointData = vtk.vtkPoints()
for ptId in range(data.shape[0]):
dataPt = data[ptId]
toPad = 3 - data.shape[1]
if toPad > 0:
embedPt = np.pad(dataPt, (0,toPad))
pointData.InsertNextPoint(dataPt[0], dataPt[1], dataPt[2])
polydata = vtk.vtkPolyData()
polydata.SetPoints(pointData)
scalarAr = vtk.vtkFloatArray()
scalarAr.SetName(scalarName)
scalarAr.SetNumberOfValues(len(scalars))
ptId = 0
if not isinstance(scalars[0], np.ndarray):
newArray = np.unique(scalars, return_inverse=True)[1]
for val in newArray:
scalarAr.SetValue(ptId, float(val))
ptId += 1
else:
for val in scalars:
scalarAr.SetValue(ptId, float(val))
ptId += 1
polydata.GetPointData().AddArray(scalarAr)
polydata.GetPointData().SetActiveScalars(scalarName)
return polydata
polydata = convertToPolydata(data, scalarName, scalars)
```
**Create instances of the class and pass in POLYDATA (points to be coloured by scalars)**
```python
data1 = spherePipeline()
data1.setInput(polydata)
```
**Show the geometries in the viewer**
```python
View.geometries = [data1.getGeometry(), points1.getGeometry(), points2.getGeometry(), points3.getGeometry()]
View
```
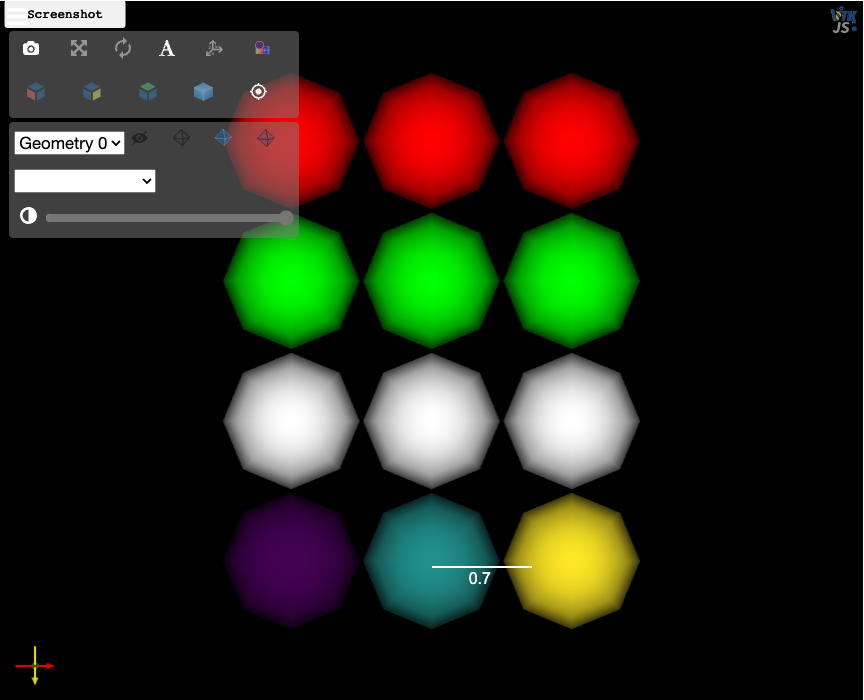
**Viewer Output:**
Note that the Blue glyphs have changed colour!
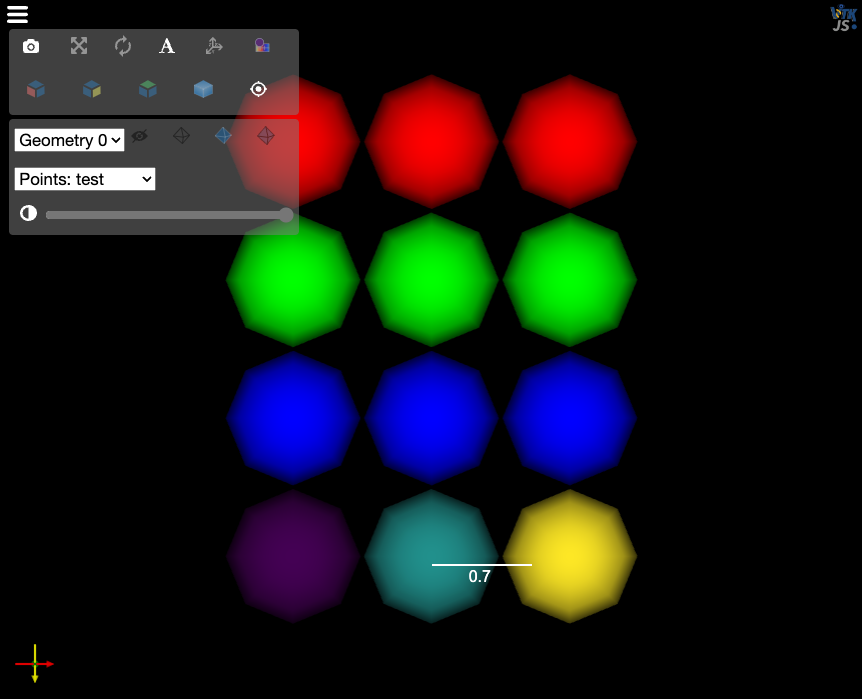
**NOTE:** If I create a new Viewer (i.e.
`itkwidgets.view(geometries=[data1.getGeometry(), points1.getGeometry(), points2.getGeometry(), points3.getGeometry()], background=[0.0, 0.0, 0.0])`
the colours are presented correctly.
---
### Author:  [@dzenanz](https://discourse.itk.org/u/dzenanz)
#### Post date: [October 26, 2022, 12:24pm UTC](https://discourse.itk.org/t/adding-additional-geometries-to-viewer-changes-colours-of-outputs/5449/2 "2022-10-26T12:24:57Z")
@PaulHax and @matt.mccormick might have ideas.
---
### Author:  [@PaulHax](https://discourse.itk.org/u/PaulHax)
#### Post date: [October 26, 2022, 12:44pm UTC](https://discourse.itk.org/t/adding-additional-geometries-to-viewer-changes-colours-of-outputs/5449/3 "2022-10-26T12:44:55Z")
Hi Kevin,
Bug! Thanks for the report and example. Lets get geometry loading on the 1.X alpha `main` branch and make sure this use is supported.
>
>
> Hi,
> I am using \`itkwidgets\<1.0\` to visualize finite element meshes (sometimes 2…D, sometimes 3D) and fields defined on them, often through \`pyvista\`.
>
> \`itkwidgets\` goal on \`master\` branch is stated as
>
> \> Interactive Jupyter widgets to visualize images, point sets, and meshes on the web.
>
> while on the \`main\` branch it is
>
> \> Interactive widgets to visualize images, point sets, and 3D geometry on the web.
>
> with no mention of "meshes".
>
> With this I would like to ask if users can expect support for meshes to be added back to \`main\` at some point in future, or if that is not something you are interested in anymore.
>
> Thanks,
> Francesco
---
### Author:  [@Kevin\_Sweeney](https://discourse.itk.org/u/Kevin_Sweeney)
#### Post date: [October 26, 2022, 1:30pm UTC](https://discourse.itk.org/t/adding-additional-geometries-to-viewer-changes-colours-of-outputs/5449/4 "2022-10-26T13:30:18Z")
Thanks @PaulHax, good to know it is not just me making some mistakes. Look forward to the fix