# ~8x slower registration with itk-elastix Python API vs elastix CLI — minimal reproducible example
**URL:** https://discourse.itk.org/t/8x-slower-registration-with-itk-elastix-python-api-vs-elastix-cli-minimal-reproducible-example/7736
**Category:** Engineering
**Tags:** performance, itk-elastix, elastix
**Created:** [March 22, 2026, 1:48pm UTC](https://discourse.itk.org/t/8x-slower-registration-with-itk-elastix-python-api-vs-elastix-cli-minimal-reproducible-example/7736 "2026-03-22T13:48:26Z")
**Posts on this page:** 20
**Page:** 2
### Author:  [@NicoKiaru](https://discourse.itk.org/u/NicoKiaru)
#### Post date: [March 27, 2026, 4:03pm UTC](https://discourse.itk.org/t/8x-slower-registration-with-itk-elastix-python-api-vs-elastix-cli-minimal-reproducible-example/7736/21 "2026-03-27T16:03:42Z")
> should be fixed by adding a line of code, `erm.SetNumberOfThreads(n_threads)`, in order to do a fair comparison between CLI and itk-elastix?
👍 Yes that’s right, I modified the script below to take this into account.
I’ve modified the benchmark to mimic the scenarios I have in my application, which is the execution of many registration jobs in parallel:
[bench-parallel.py](https://discourse.itk.org/uploads/short-url/eDqYrnVBdy1jrozhlMZIbmCEj8u.py) (12.4 KB)
I tested:
- ITK\_GLOBAL\_DEFAULT\_THREADER = Platform vs Pool
- Number of threads per job = 1 or 12
- Number of parallel jobs = 1 or 6 or 32
If a single job is processed, then itk-elastix is on par with CLI. But when jobs are run in parallel, itk-elastix stays at least 4× slower than CLI:
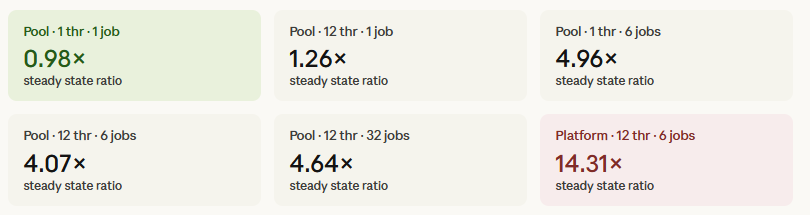
In short, Platform is worse than Pool. And within Pool, using 12 threads per job instead of 1 gives a ~2× speedup. But there’s a ~4× penalty I can’t eliminate when many jobs are run in parallel.
(claude discussion with full results: [https://claude.ai/share/de059ec6-e4b8-4c55-9cc4-cac89f18af4d](https://claude.ai/share/de059ec6-e4b8-4c55-9cc4-cac89f18af4d))
(I used itk-elastix 0.25.2 vs elastix-5.2.0)
---
### Author:  [@blowekamp](https://discourse.itk.org/u/blowekamp)
#### Post date: [March 27, 2026, 5:31pm UTC](https://discourse.itk.org/t/8x-slower-registration-with-itk-elastix-python-api-vs-elastix-cli-minimal-reproducible-example/7736/22 "2026-03-27T17:31:16Z")
There is a lot of different things going on with this scenario with threads, process, and the Python GIL. And also with the thread pool being shared in a single process.
ITK Python 6.0 will enable the GIL to be unlocked but that is just in beta now. I have a local compiled version of SimpleITK with Elastix which I added to your benchmarking. SimpleITK does unlock the GIL similar to ITK Python for the next release.
`$ python bench_parallel.py --fixed blobs.tif --moving blobs-rot15deg.tif --runs 4 --threads 2 --elastix bin/elastix --parallel 4`
| Run | CLI wall(s) | CLI avg(s) | ITK wall(s) | ITK avg(s) | SITK wall(s) | SITK avg(s) | itk/cli wall | sitk/cli wall |
| --- | --- | --- | --- | --- | --- | --- | --- | --- |
| \*1 | 1.619 | 1.577 | 18.198 | 1.527 | 1.910 | 1.831 | 11.24x | 1.18x |
| 2 | 1.592 | 1.555 | 6.194 | 1.536 | 1.922 | 1.804 | 3.89x | 1.21x |
| 3 | 1.570 | 1.542 | 6.103 | 1.508 | 1.884 | 1.801 | 3.89x | 1.20x |
| 4 | 1.599 | 1.541 | 6.132 | 1.507 | 1.861 | 1.793 | 3.84x | 1.16x |
`$python bench_parallel.py --fixed blobs.tif --moving blobs-rot15deg.tif --runs 6 --threads 2 --elastix bin/elastix --parallel 4`
| Run | CLI wall(s) | CLI avg(s) | ITK wall(s) | ITK avg(s) | SITK wall(s) | SITK avg(s) | itk/cli wall | sitk/cli wall |
| --- | --- | --- | --- | --- | --- | --- | --- | --- |
| \*1 | 2.219 | 2.112 | 20.769 | 1.517 | 2.293 | 2.170 | 9.36x | 1.03x |
| 2 | 2.144 | 2.114 | 9.198 | 1.506 | 2.215 | 2.136 | 4.29x | 1.03x |
| 3 | 2.091 | 2.015 | 9.128 | 1.507 | 2.289 | 2.194 | 4.37x | 1.09x |
| 4 | 2.068 | 2.030 | 9.139 | 1.493 | 2.313 | 2.199 | 4.42x | 1.12x |
This is on a Mac M1 Pro with 10-ish cores. For high through put of jobs (getting through many jobs as quick as possible), I find 2-threads per ITK job, and 0.5-0.75 number of jobs to be the most efficient.
There is ALOT going on here for you to tune!
---
### Author:  [@NicoKiaru](https://discourse.itk.org/u/NicoKiaru)
#### Post date: [March 27, 2026, 5:52pm UTC](https://discourse.itk.org/t/8x-slower-registration-with-itk-elastix-python-api-vs-elastix-cli-minimal-reproducible-example/7736/23 "2026-03-27T17:52:28Z")
This looks awesome! Do you think I can use sitk as a drop-in replacement for elastix, given the example registration in this benchmark ? Maybe, if I understand correctly, the fancy GIL free versions have not been released yet ? Neither for itk-elastix nor for sitk ? Do you know if there’s an approximate timeline for this release ?
Thanks!
---
### Author:  [@dzenanz](https://discourse.itk.org/u/dzenanz)
#### Post date: [March 27, 2026, 6:09pm UTC](https://discourse.itk.org/t/8x-slower-registration-with-itk-elastix-python-api-vs-elastix-cli-minimal-reproducible-example/7736/24 "2026-03-27T18:09:37Z")
With many jobs run in parallel, you should strongly consider using `TBB` multi threader. It does some kind of machine-wide balancing. I think it is available with already released ITK, and therefore `itk-elastix`.
I agree with Brad, when you have many jobs running in parallel, within-job parallelism should be low.
---
### Author:  [@Niels\_Dekker](https://discourse.itk.org/u/Niels_Dekker)
#### Post date: [April 3, 2026, 4:03pm UTC](https://discourse.itk.org/t/8x-slower-registration-with-itk-elastix-python-api-vs-elastix-cli-minimal-reproducible-example/7736/25 "2026-04-03T16:03:20Z")
I’m still trying to understand the problem observed with the original benchmark. It looks like the specified number of threads doesn’t really matter in this case, as long as it is greater than zero!
The original slowness of the benchmark function `run_itk` disappears when I only add the following line, directly after the `import itk`:
```
itk.MultiThreaderBase.SetGlobalDefaultNumberOfThreads(1)
```
I’m trying to understand why! I do know that this GlobalDefaultNumberOfThreads is used by the constructor of ITK’s ThreadPool:
>
So then, what happens when GlobalDefaultNumberOfThreads is not explicitly specified? Is ITK’s ThreadPool then still properly constructed? Does the Python wrapper tweak the ThreadPool somehow? Do you have a clue?
---
### Author:  [@dzenanz](https://discourse.itk.org/u/dzenanz)
#### Post date: [April 3, 2026, 7:15pm UTC](https://discourse.itk.org/t/8x-slower-registration-with-itk-elastix-python-api-vs-elastix-cli-minimal-reproducible-example/7736/26 "2026-04-03T19:15:36Z")
The entire function is [here](https://github.com/InsightSoftwareConsortium/ITK/blob/v5.4.5/Modules/Core/Common/src/itkMultiThreaderBase.cxx#L265-L336), which (in the absence of other specifications) delegates to the [platform-specific function](https://github.com/InsightSoftwareConsortium/ITK/blob/v5.4.5/Modules/Core/Common/src/itkMultiThreaderBase.cxx#L338-L386). There is a global maximum defined [here](https://github.com/InsightSoftwareConsortium/ITK/blob/b94cca512790c81e119bb9d6acb1f9ead09d4ebf/Modules/Core/Common/CMakeLists.txt#L30-L36).
---
### Author:  [@Niels\_Dekker](https://discourse.itk.org/u/Niels_Dekker)
#### Post date: [April 7, 2026, 2:06pm UTC](https://discourse.itk.org/t/8x-slower-registration-with-itk-elastix-python-api-vs-elastix-cli-minimal-reproducible-example/7736/27 "2026-04-07T14:06:22Z")
I did try a similar benchmark in C++ as well, having an executable written in C++, linked to “elastix-5.3.1.lib” and its dependencies, built with MSVC 2026 (Release). It suggested the following relation between selected number of threads (`erm->SetNumberOfThreads(n_threads)`) and registration duration:
```
n_threads = 0 ==> 2.8 sec
n_threads = 1 ==> 2.9 sec
n_threads = 2 ==> 1.6 sec
n_threads = 4 ==> 1.0 sec
n_threads = 8 ==> 0.7 sec
n_threads = 16 ==> 0.8 sec
n_threads = 32 ==> 0.9 sec
n_threads = 64 ==> 1.4 sec
```
So in C++, I do not see a particular slowness when `n_threads = 0`.
The code is below here:
```c++
#include
#include
#include
#include
#include
#include
#include
#include
#include
#include
namespace
{
void
run_cpp(const std::string & fixed,
const std::string & moving,
const std::string & param_file,
const unsigned int n_threads)
{
using ImageType = itk::Image;
const auto fixed_img = itk::ReadImage(fixed);
const auto moving_img = itk::ReadImage(moving);
const auto param_obj = elx::ParameterObject::New();
param_obj->ReadParameterFile(param_file);
const std::filesystem::path out_dir = [] {
const std::time_t nowTime = std::chrono::system_clock::to_time_t(std::chrono::system_clock::now());
std::tm nowTm{};
localtime_s(&nowTm, &nowTime);
std::ostringstream outputStringStream;
outputStringStream << std::put_time(&nowTm, "elastix_cpp_%Y-%m-%dT%H.%M.%S");
return outputStringStream.str();
}();
std::filesystem::create_directory(out_dir);
const auto erm = itk::ElastixRegistrationMethod::New();
erm->SetFixedImage(fixed_img);
erm->SetMovingImage(moving_img);
erm->SetParameterObject(param_obj);
erm->SetOutputDirectory(out_dir.string());
erm->SetLogToConsole(false);
erm->SetLogToFile(true);
erm->SetNumberOfThreads(n_threads);
const auto t0 = std::chrono::high_resolution_clock::now();
erm->UpdateLargestPossibleRegion();
const auto elapsed =
std::chrono::duration_cast>(std::chrono::high_resolution_clock::now() - t0).count();
const auto transform = out_dir / "TransformParameters.0.txt";
const bool ok{ std::filesystem::exists(transform) };
std::cout << " [elx-c++] " << elapsed << " s transform exists: ok " << std::boolalpha << ok << std::endl;
}
} // namespace
int
main()
{
try
{
for (const unsigned int n_threads : { 0, 1, 2, 4, 8, 16, 32, 64 })
{
std::cout << "n_threads = " << n_threads << std::endl;
for (int i{}; i < 3; ++i)
{
run_cpp("blobs.tif", "blobs-rot15deg.tif", "params_bspline.txt", n_threads);
}
}
}
catch (const std::exception & stdException)
{
std::cout << stdException.what();
}
} // end main()
```
* * *
Update: I realize now that calling SetNumberOfThreads multiple times in C++, during the run of one and the same process isn’t so effective, because the size of the ITK ThreadPool is not adjusted anymore after its initialization. To be continued…
---
### Author:  [@Niels\_Dekker](https://discourse.itk.org/u/Niels_Dekker)
#### Post date: [April 13, 2026, 4:45pm UTC](https://discourse.itk.org/t/8x-slower-registration-with-itk-elastix-python-api-vs-elastix-cli-minimal-reproducible-example/7736/28 "2026-04-13T16:45:24Z")
> [@dzenanz](#):
>
> With many jobs run in parallel, you should strongly consider using `TBB` multi threader. It does some kind of machine-wide balancing. I think it is available with already released ITK, and therefore `itk-elastix`.
It looks like TBB is already the default multi threader in itk-elastix!
```
print(itk.MultiThreaderBase.GetGlobalDefaultThreader())
```
Prints `2`, when I’m using itk-elastix 0.25.2 on Windows.
```
print(erm.GetMultiThreader())
```
prints:
```auto
TBBMultiThreader (000001B8F5D0DD60)
RTTI typeinfo: class itk::TBBMultiThreader
Reference Count: 2
Modified Time: 68
Debug: Off
Object Name:
Observers:
none
Number of Work Units: 1024
Number of Threads: 64
Global Maximum Number Of Threads: 128
Global Default Number Of Threads: 64
Global Default Threader Type: itk::MultiThreaderBaseEnums::Threader::TBB
SingleMethod: 0000000000000000
SingleData: 0000000000000000
GetNumberOfThreads 0
GetGlobalDefaultNumberOfThreads 64
GetGlobalMaximumNumberOfThreads 128
```
Does TBB MultiThreader require calling SetGlobalDefaultNumberOfThreads or SetGlobalMaximumNumberOfThreads, before it can be used efficiently?
---
### Author:  [@dzenanz](https://discourse.itk.org/u/dzenanz)
#### Post date: [April 13, 2026, 9:03pm UTC](https://discourse.itk.org/t/8x-slower-registration-with-itk-elastix-python-api-vs-elastix-cli-minimal-reproducible-example/7736/29 "2026-04-13T21:03:20Z")
It does some load balancing while splitting the region into chunks. I don’t think that requires changing the number of threads. But if you know stuff about number of threads, it is advisable to exploit it.
---
### Author:  [@Niels\_Dekker](https://discourse.itk.org/u/Niels_Dekker)
#### Post date: [April 15, 2026, 2:25pm UTC](https://discourse.itk.org/t/8x-slower-registration-with-itk-elastix-python-api-vs-elastix-cli-minimal-reproducible-example/7736/30 "2026-04-15T14:25:35Z")
It looks like `itk::TBBMultiThreader` has many more Work Units than `itk::PoolMultiThreader`, by default. As I mentioned before:
```auto
TBBMultiThreader (000001B8F5D0DD60)
RTTI typeinfo: class itk::TBBMultiThreader
Reference Count: 2
Modified Time: 68
Debug: Off
Object Name:
Observers:
none
Number of Work Units: 1024
```
Whereas when ITK’s PoolThreader is selected (by `itk.MultiThreaderBase.SetGlobalDefaultThreader(1)`), `print(erm.GetMultiThreader())` prints:
```auto
PoolMultiThreader (0000016A759A2260)
RTTI typeinfo: class itk::PoolMultiThreader
Reference Count: 2
Modified Time: 68
Debug: Off
Object Name:
Observers:
none
Number of Work Units: 128
```
Does that explain why TBBMultiThreader is so much slower, by default? Because it uses 1024 work units, whereas PoolThreader just uses 128 work units?
It looks like itk-elastix uses TBBMultiThreader by default, whereas the CLI (elastix.exe) uses the PoolThreader.
* * *
For the record, the default-constructors of `TBBMultiThreader` and `PoolMultiThreader` assign different values to `m_NumberOfWorkUnits`, here:
>
>
---
### Author:  [@matt.mccormick](https://discourse.itk.org/u/matt.mccormick)
#### Post date: [May 1, 2026, 7:47pm UTC](https://discourse.itk.org/t/8x-slower-registration-with-itk-elastix-python-api-vs-elastix-cli-minimal-reproducible-example/7736/31 "2026-05-01T19:47:39Z")
Excellent discussion, everyone - thank you for the detailed profiling and repros.
I’ve reproduced the results others have reported and can confirm that, for many paths, the ITK‑elastix Python wrapping runs the same or even faster than the `elastix` binary when using the `Pool` threading backend. It is interesting that the `avg` part of the call is sometimes faster, while the `wall` time is significantly slower; this gap is not just noise but points to real overhead outside the actual registration kernel.
One key factor is the TBB threading backend. As Neils noted, TBB has sub‑optimal tuning for modern multi‑core systems and may not play well with the particular classes and workloads being exercised here. For ITK 6, it may make sense to either remove TBB support from the Python packages or, at minimum, tune the work‑unit model far more aggressively both in general and for the classes involved in elastix‑driven registration.
The difference between `wall` and `avg` metrics largely reflects module‑import and initialization overhead. The recently released `itk‑elastix` 0.23.3 includes additional GIL‑release protections, which helps in some scenarios, but there are other factors at play. In Nico’s `bench‑parallel.py` benchmark, one notable element is an extra thread‑lock that surfaces a hint at part of this overhead; the bottleneck is not only the registration loop itself but also the machinery around it.
ITK has long used a custom lazy‑loading system for its wrapping, which dates from the Python 2.6 / early‑WrapITK era when developers were still using techonology like CVS. This system does improve the developer experience by limiting import time and memory footprint, but it comes at the cost of numerous locks, bookkeeping, and extra infrastructure for pickling and cross‑module references, which both degrades performance and introduces subtle bugs in corner cases.
Since Python 3.7, PEP 562 has provided the core language support needed to replace this custom lazy‑loading machinery with a more standard, CPython mechanism. The scikit‑image community has already embraced this pattern, and the broader scientific‑Python ecosystem is moving toward it via the Scientific‑Python SPEC‑0001.
A corresponding patch for ITK 6 is under review here, which proposes using PEP 562‑style ` __getattr__ `‑driven lazy loading instead of the current home‑grown scheme:
[ENH: Replace custom LazyITKModule with native PEP 562 lazy loading by thewtex · Pull Request #6183 · InsightSoftwareConsortium/ITK · GitHub](https://github.com/InsightSoftwareConsortium/ITK/pull/6183).
This change will help, but what is even more critical is that we (re‑)organize ITK’s classes into modules and clean up the module‑dependency graph so that importing from one module does not implicitly pull in nearly every other ITK module. CC @hjmjohnson @simon.rit
---
### Author:  [@Niels\_Dekker](https://discourse.itk.org/u/Niels_Dekker)
#### Post date: [May 5, 2026, 1:44pm UTC](https://discourse.itk.org/t/8x-slower-registration-with-itk-elastix-python-api-vs-elastix-cli-minimal-reproducible-example/7736/32 "2026-05-05T13:44:18Z")
Thanks Matt!
In the mean time, I think I found a way to very much improve the speed of the registration from the benchmark of @NicoKiaru, specifically when the number of work units is large. This is especially relevant when the user does _not_ explicitly specify the (maximum) number of threads to be used.
>
>
> Made \`ParzenWindowHistogramImageToImageMetric::AfterThreadedComputePDFs\` much fa…ster.
>
> The registration test case of the benchmark by Nicolas Chiaruttini (https://discourse.itk.org/t/8x-slower-registration-with-itk-elastix-python-api-vs-elastix-cli-minimal-reproducible-example/7736) appears to run more than 30 % faster with the CLI (elastix executable), from ~3 seconds to ~2 seconds on Window 11, at "my" \[LKEB/LUMC\](https://www.lkeb.nl/) pc (AMD Threadripper, 32-Cores, 4 GHz, 64 logical processors), when using the default number of work units for the metric (\`ITK\_MAX\_THREADS\`, which is 128 for the executable), so without specifying "-threads".
I think this pull request is more “cache-friendly” than the original AfterThreadedComputePDFs function implementation, because it no longer iterates over all “per thread” histograms simultaneously. It should improve the speed of both the CLI and the Python wrappings.
Of course, it may take some time before this improvement is released 🤷
---
### Author:  [@Niels\_Dekker](https://discourse.itk.org/u/Niels_Dekker)
#### Post date: [May 29, 2026, 2:43pm UTC](https://discourse.itk.org/t/8x-slower-registration-with-itk-elastix-python-api-vs-elastix-cli-minimal-reproducible-example/7736/33 "2026-05-29T14:43:08Z")
This week I made another benchmark, inspired by the benchmark posted here ([benchmark-itk.zip](https://discourse.itk.org/uploads/short-url/7rKY7Cpu1seihULmmRF0jbuZNGI.zip)) by @NicoKiaru: I called it “TBB-bench.py”:
[TBB-bench.py](https://discourse.itk.org/uploads/short-url/2uGDERbkuB4TFzD0jf40jhTwLfx.py) (4.3 KB)
“TBB-bench.py” compares a default build of elastix.exe (_without_ TBB) versus an elastix.exe build _with_ TBB (Threading Building Blocks), enabled by building ITK with `Module_ITKTBB=ON`, using oneapi-tbb-2023.0.0 from [Releases · uxlfoundation/oneTBB · GitHub](https://github.com/uxlfoundation/oneTBB/releases)
To my surprise, elastix.exe with TBB mostly appears slower than without TBB, even when the requested number of threads is the same for both, and explicitly specified by `-threads`. Below here are the results, from an AMD Threadripper (32-Cores, 4 GHz, 64 logical processors) Windows 11 PC. The duration is in second(s). The case n\_threads = 0 is for when the user does not specify the requested number of threads.
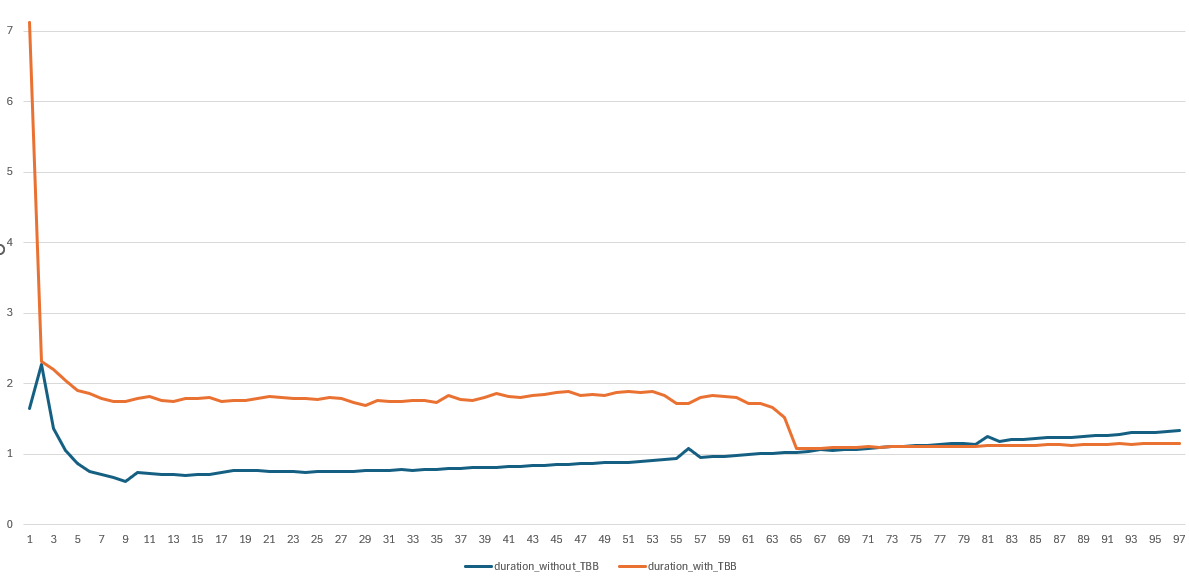
| n\_threads | duration\_without\_TBB | duration\_with\_TBB |
| --- | --- | --- |
| 0 | 1.6542712 | 7.1273871 |
| 1 | 2.2741911 | 2.3132669 |
| 2 | 1.3645619 | 2.2048516 |
| 3 | 1.052461 | 2.048905 |
| 4 | 0.8700537 | 1.9107928 |
| 5 | 0.7605497 | 1.8583794 |
| 6 | 0.7059141 | 1.7926508 |
| 7 | 0.666884 | 1.7459283 |
| 8 | 0.6174228 | 1.7452462 |
| 9 | 0.7373062 | 1.7849961 |
| 10 | 0.730327 | 1.824885 |
| 11 | 0.7125332 | 1.7569295 |
| 12 | 0.7104104 | 1.7517425 |
| 13 | 0.7046995 | 1.7862731 |
| 14 | 0.7172823 | 1.7890404 |
| 15 | 0.7082492 | 1.798524 |
| 16 | 0.7368737 | 1.7432894 |
| 17 | 0.774715 | 1.7584191 |
| 18 | 0.7725147 | 1.7687291 |
| 19 | 0.7698721 | 1.784001 |
| 20 | 0.7513644 | 1.820441 |
| 21 | 0.7615312 | 1.8088087 |
| 22 | 0.7508368 | 1.7948854 |
| 23 | 0.7459839 | 1.7905736 |
| 24 | 0.7607463 | 1.7833191 |
| 25 | 0.7521392 | 1.7977883 |
| 26 | 0.7549257 | 1.7944212 |
| 27 | 0.7551818 | 1.7315316 |
| 28 | 0.7709924 | 1.6951219 |
| 29 | 0.7694975 | 1.766793 |
| 30 | 0.7675818 | 1.7494544 |
| 31 | 0.7769753 | 1.7492807 |
| 32 | 0.7729977 | 1.7640508 |
| 33 | 0.7843472 | 1.757292 |
| 34 | 0.7851376 | 1.7365996 |
| 35 | 0.7906982 | 1.8302265 |
| 36 | 0.8011032 | 1.7834286 |
| 37 | 0.8061355 | 1.7579107 |
| 38 | 0.8053329 | 1.8100656 |
| 39 | 0.812559 | 1.8556431 |
| 40 | 0.8228866 | 1.8209425 |
| 41 | 0.828274 | 1.8109645 |
| 42 | 0.8328906 | 1.8358188 |
| 43 | 0.8364043 | 1.8425897 |
| 44 | 0.8486397 | 1.8792424 |
| 45 | 0.8560286 | 1.8953346 |
| 46 | 0.8661876 | 1.8326492 |
| 47 | 0.8698843 | 1.8482879 |
| 48 | 0.8761915 | 1.8332115 |
| 49 | 0.8852525 | 1.8718429 |
| 50 | 0.8869483 | 1.8960955 |
| 51 | 0.9011857 | 1.8738916 |
| 52 | 0.9102948 | 1.8871461 |
| 53 | 0.924503 | 1.8358398 |
| 54 | 0.9391825 | 1.7216499 |
| 55 | 1.0785382 | 1.7174889 |
| 56 | 0.9472642 | 1.8015949 |
| 57 | 0.9669115 | 1.8277775 |
| 58 | 0.96824 | 1.8143385 |
| 59 | 0.9773191 | 1.8068078 |
| 60 | 0.9904145 | 1.7133814 |
| 61 | 1.0069246 | 1.7145204 |
| 62 | 1.0035063 | 1.6622143 |
| 63 | 1.0173213 | 1.514634 |
| 64 | 1.0236915 | 1.0819796 |
| 65 | 1.0392118 | 1.0807675 |
| 66 | 1.0618944 | 1.0880275 |
| 67 | 1.0518364 | 1.0941594 |
| 68 | 1.0628103 | 1.0969923 |
| 69 | 1.0670978 | 1.0964156 |
| 70 | 1.0819559 | 1.1032364 |
| 71 | 1.0949304 | 1.0943044 |
| 72 | 1.1036258 | 1.1026695 |
| 73 | 1.1164163 | 1.1059809 |
| 74 | 1.1170646 | 1.108541 |
| 75 | 1.1264056 | 1.1106693 |
| 76 | 1.1348325 | 1.1125788 |
| 77 | 1.1467245 | 1.1098215 |
| 78 | 1.1507384 | 1.1121437 |
| 79 | 1.1435649 | 1.1158801 |
| 80 | 1.2537306 | 1.1203464 |
| 81 | 1.1833133 | 1.1257452 |
| 82 | 1.2044805 | 1.1209004 |
| 83 | 1.2113157 | 1.1257512 |
| 84 | 1.2217503 | 1.1211748 |
| 85 | 1.2317465 | 1.1310394 |
| 86 | 1.239599 | 1.1337392 |
| 87 | 1.2358785 | 1.1270684 |
| 88 | 1.2450029 | 1.1359822 |
| 89 | 1.2695184 | 1.1417371 |
| 90 | 1.2649092 | 1.1376678 |
| 91 | 1.2815956 | 1.14886 |
| 92 | 1.3033637 | 1.1434429 |
| 93 | 1.3034942 | 1.1457794 |
| 94 | 1.3124357 | 1.1489657 |
| 95 | 1.3178227 | 1.1559703 |
| 96 | 1.331881 | 1.1499086 |
---
### Author:  [@dzenanz](https://discourse.itk.org/u/dzenanz)
#### Post date: [May 29, 2026, 7:56pm UTC](https://discourse.itk.org/t/8x-slower-registration-with-itk-elastix-python-api-vs-elastix-cli-minimal-reproducible-example/7736/34 "2026-05-29T19:56:11Z")
This is shocking. Especially the `threads=0` case. Also quite interesting is that 65+ threads reaches peak performance. But shouldn’t `threads=0` case be equivalent to `threads=64` or `threads=32`?
---
### Author:  [@blowekamp](https://discourse.itk.org/u/blowekamp)
#### Post date: [June 1, 2026, 1:10pm UTC](https://discourse.itk.org/t/8x-slower-registration-with-itk-elastix-python-api-vs-elastix-cli-minimal-reproducible-example/7736/35 "2026-06-01T13:10:27Z")
@Niels_Dekker You should be able to use just one executable for this can control which threader to use. The environment variable “ITK\_GLOBAL\_DEFAULT\_THREADER” can be set to TBB, POOL, or PLATFORM, I believe. And then there is “SINGLE” that was just added recently 🙂 I am curious about all.
Is this testing with the 2D 256x256 image? That is a rather small image to test scaling with.
But there is definitely something odd happening with the TBB. The defaults for TBB would be 64 thread with 16x work units, while the elastix control is setting the number of work units and threads to be the same?
---
### Author:  [@Niels\_Dekker](https://discourse.itk.org/u/Niels_Dekker)
#### Post date: [June 2, 2026, 12:39pm UTC](https://discourse.itk.org/t/8x-slower-registration-with-itk-elastix-python-api-vs-elastix-cli-minimal-reproducible-example/7736/36 "2026-06-02T12:39:46Z")
> [@blowekamp](#):
>
> You should be able to use just one executable for this can control which threader to use. The environment variable “ITK\_GLOBAL\_DEFAULT\_THREADER” can be set to TBB, POOL, or PLATFORM, I believe.
Thanks @blowekamp, I just adjusted my benchmark as you suggested: using just one executable (the one whose ITK binaries included TBB), and comparing “POOL” and “TBB”. It produced very similar benchmark results:
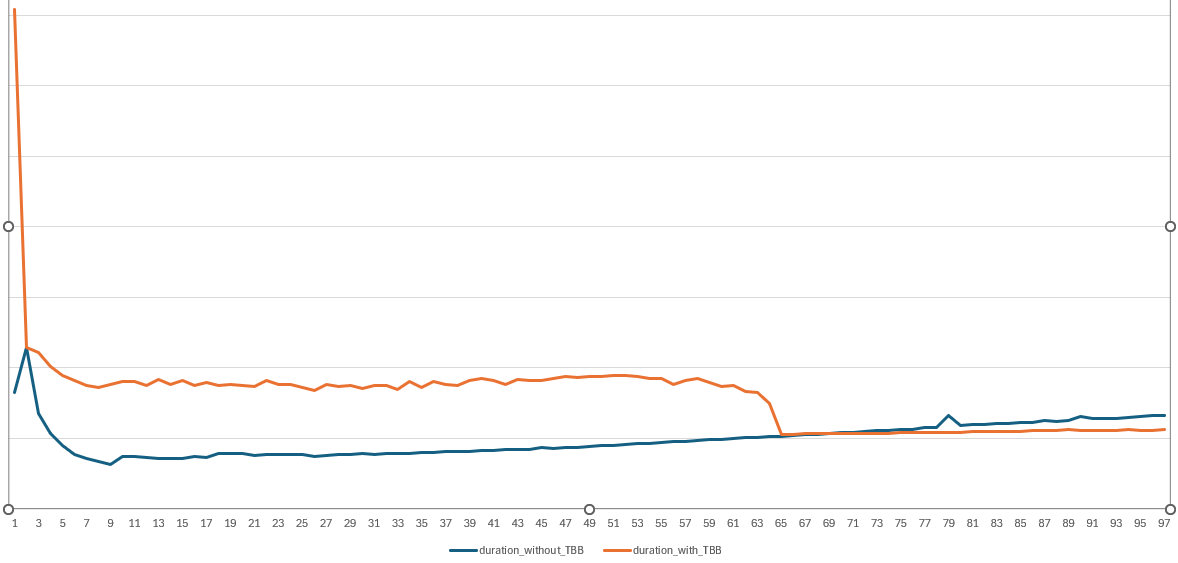
Indeed, the test images (coming from the benchmark of @NicoKiaru) are rather small (256x254, actually). It might be a good idea to use a smaller number of threads and a smaller number of work units when the images are small. But I’m sorry, elastix does not automatically adjust the number of threads or work units to the image size.
When the user specifies the number of threads (command-line argument “-threads”), elastix sets both ITK’s GlobalMaximumNumberOfThreads and the internal number of work units of the elastix registration metrics to this number.
In the registration example case of @NicoKiaru, the work units of the metric (“AdvancedMattesMutualInformation”) appear quite expensive (requiring dynamic memory allocation for each work unit). Moreover, the “AfterThreaded” post-processing (accumulating the result from the threads) also appears quite expensive when there are many work units.
---
### Author:  [@blowekamp](https://discourse.itk.org/u/blowekamp)
#### Post date: [June 2, 2026, 1:23pm UTC](https://discourse.itk.org/t/8x-slower-registration-with-itk-elastix-python-api-vs-elastix-cli-minimal-reproducible-example/7736/37 "2026-06-02T13:23:54Z")
> [@Niels\_Dekker](#):
>
> In the registration example case of @NicoKiaru, the work units of the metric (“AdvancedMattesMutualInformation”) appear quite expensive (requiring dynamic memory allocation for each work unit). Moreover, the “AfterThreaded” post-processing (accumulating the result from the threads) also appears quite expensive when there are many work units.
Yes merging histograms or other data in a single threaded fashion can be quite slow. You might find the approach using in LabelStatisticImageFilter useful for reference.
[ITK/Modules/Filtering/ImageStatistics/include/itkLabelStatisticsImageFilter.hxx at fc3590bf3bed62a9d77a1587c7b190fa25d52f82 · InsightSoftwareConsortium/ITK · GitHub](https://github.com/InsightSoftwareConsortium/ITK/blob/fc3590bf3bed62a9d77a1587c7b190fa25d52f82/Modules/Filtering/ImageStatistics/include/itkLabelStatisticsImageFilter.hxx#L244-L266) It performs the merges concurrently during threading instead of after.
---
### Author:  [@Niels\_Dekker](https://discourse.itk.org/u/Niels_Dekker)
#### Post date: [June 5, 2026, 12:04pm UTC](https://discourse.itk.org/t/8x-slower-registration-with-itk-elastix-python-api-vs-elastix-cli-minimal-reproducible-example/7736/38 "2026-06-05T12:04:42Z")
> [@blowekamp](#):
>
> Yes merging histograms or other data in a single threaded fashion can be quite slow. You might find the approach using in LabelStatisticImageFilter useful for reference.
Thanks for the suggestion, @blowekamp Is this what you had in mind?
>
>
> Inspired by a suggestion from Bradley Lowekamp (@blowekamp), June 2, 2026, at ht…tps://discourse.itk.org/t/8x-slower-registration-with-itk-elastix-python-api-vs-elastix-cli-minimal-reproducible-example/7736/37
>
> \----
> A major performance improvement (10% to 40%) of elastix.exe was observed on the benchmark data set from https://discourse.itk.org/t/8x-slower-registration-with-itk-elastix-python-api-vs-elastix-cli-minimal-reproducible-example (by @NicoKiaru). However, this PR might cause slightly different results, because it may change the order of additions of floating point numbers, during accumulation.
I observed a major performance improvement (10% to 40%), when moving the accumulation of joint histograms from the “AfterThreaded” member function to the “Threaded” member function (even though it adds mutex locking).
However it _might_ yield slightly different results, each time the joint histogram is computed, because it might add floating point numbers in a different order, each time. And you know, for floating point numbers, `a + b + c` may not be _exactly_ equal to `b + c + a`. So I feel reluctant to merge this PR. 🤷
---
### Author:  [@blowekamp](https://discourse.itk.org/u/blowekamp)
#### Post date: [June 5, 2026, 1:04pm UTC](https://discourse.itk.org/t/8x-slower-registration-with-itk-elastix-python-api-vs-elastix-cli-minimal-reproducible-example/7736/39 "2026-06-05T13:04:45Z")
The perforce improvement for the small images should be much more than that. Your implementation is different than the algorithm I linked too.
```auto
while (true)
{
MapType tomerge{};
{
const std::lock_guard lockGuard(m_Mutex);
if (m_LabelStatistics.empty())
{
swap(m_LabelStatistics, localStatistics);
break;
}
// Move the data of the output map to the local `tomerge` and clear the output map.
swap(m_LabelStatistics, tomerge);
} // release lock, allow other threads to merge data
// Merge tomerge into localStatistics, locally
MergeMap(localStatistics, tomerge);
}
}
```
In this algorithm the key thing to note, is that the lock is only held for an `if` and a `swap`. The lock is not held during the expensive merge. ~~However, there is sometime a new “merge object” that needs to be allocated on the threads. So there is a little bit more memory overhead.~~ Each thread or work unit allocates a new merge object, then merges if the class output is there. No extra allocation is needed.
With your implementation all threads block for the merging, while with the above implementation concurrent merging can occour.
Yes, unfortunately the floating point results are now non-deterministic. This can sometime be overcome with a higher bit accumulator or Kahan summation algorithm. There is another tree-based merge algorithm that can be implemented, but this simple parallel merge algorithm should give more gains than your linked implementation.
---
### Author:  [@Niels\_Dekker](https://discourse.itk.org/u/Niels_Dekker)
#### Post date: [June 5, 2026, 7:14pm UTC](https://discourse.itk.org/t/8x-slower-registration-with-itk-elastix-python-api-vs-elastix-cli-minimal-reproducible-example/7736/40 "2026-06-05T19:14:41Z")
> [@blowekamp](#):
>
> this simple parallel merge algorithm should give more gains than your linked implementation.
Sorry, I tried such a “forever loop” (`while (true)`) that just has constant-time operations (`if` and `swap`) in the locked section, but I could not make it faster than the initial WIP PR that I made ([WIP: PERF: Accumulate joint histograms in ThreadedComputePDFs by N-Dekker · Pull Request #1451 · SuperElastix/elastix · GitHub](https://github.com/SuperElastix/elastix/pull/1451)). The situation is a bit different from LabelStatisticsImageFilter, as elastix ParzenWindowHistogramImageToImageMetric has preallocated 2D joint histograms (`itk::Image`) for all of its work units, as well as a preallocated resulting 2D joint histogram, `m_JointPDF`, which eventually holds the accumulation of the histograms from work units. Without going into too much detail here: I find it difficult! 🤷
[Previous page](https://discourse.itk.org/t/8x-slower-registration-with-itk-elastix-python-api-vs-elastix-cli-minimal-reproducible-example/7736.md?page=1)